Student Handouts
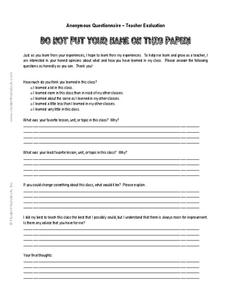
Teacher Evaluation Sheet
As you approach the end of the school year, ask your class members to complete this anonymous questionnaire to gain insight into the strengths of your teaching, as well as areas that you can improve for next year!
Bowland
Tuck Shop
Correct a misleading conclusion. Individuals review a set of data and a conclusion to determine what is wrong with the conclusion. Pupils then represent the data with an appropriate display. Finally, learners develop a correct conclusion...
US Department of Commerce
How Does Our Class Compare?
Compare the class to the country. As a group, pupils collect data on the types of activities boys and girls do after school. Learners compare the number of girls to the number of boys for each activity. Using census data, individuals...
US Department of Commerce
Creating and Taking a Survey
Individuals learn how to conduct surveys and collect data for the class on age, pets, and number of people at home. Scholars compare their household size to the information in the census. Pupils then develop additional questions to ask...
Equality and Human Rights Commission
Learning area 4: Learn About the Meaning of Community
Scholars examine the jobs found in their community by way of surveying. After collecting data, pupils analyze their findings and share their observations with their peers. A video sparks interest. Two posters motivate participants to...
Radford University
Statistical Study
Put your knowledge of sample surveys to good use. Pupils begin by conducting a survey of class members. They identify an appropriate topic and sampling technique; collect and organize their data; compute and analyze statistical measures;...
Radford University
PHamily PHeud: An Exploration in Surveys
Get to know the class much better. Scholars brainstorm a topic of interest and then design and conduct a class survey. Using the top responses, they create a game similar to Family Feud and take part in a class competition.
Radford University
Analyzing Data from Peer Survey
We all want to know what we're thinking. Scholars analyze and report data collected in a previous survey on peer attitudes toward current events. They calculate the mean, median, range, and standard deviation before creating histograms...
Radford University
Peer Survey on Current Events
Stay up to date on current events as well as how the class views the issues. A performance task has scholars select a current event of interest and design a class survey on the topic. They conduct the survey, analyze, and report the...
Radford University
The Next Big Thing
Make sure the next product is a hit. An engaging task has scholars design an item to sell at a sports event and then conduct a marketing survey. They decide whether to use random sampling, stratified sampling, or cluster sampling, and...
Radford University
Survey Activity
It's time to take a survey. After looking at an example of a survey on lunch preferences, groups design their own surveys. They consider the sample size and sampling technique, then conduct the surveys. As a final activity, they create...
Radford University
Data Analysis Activity
What do classmates think? In groups, learners design surveys to investigate chosen topics. They conduct the survey, then analyze the results. As part of the activity, they must calculate the mean, median, mode, variance, and standard...
CK-12 Foundation
CK-12 Middle School Math Concepts - Grade 6
Twelve chapters cover a multitude of math concepts found in the Common Core standards for sixth grade. Each title provides a brief explanation of what you will find inside the chapter—concepts from which you can click on and learn more...
Radford University
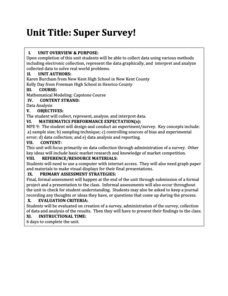
Super Survey!
Here's a super survey on supermarket products. An interactive lesson has classmates design and conduct surveys on a product of interest. They analyze the data, choose a data display method, and present their findings to the class.
Radford University
Marketing Mayhem: Advertising for Adolescents
You'll be sold on using the resource. Future consumers first conduct a sample survey on marketing strategies. They then consider how mass media influences their age groups and create presentations to display their findings.
Radford University
The Science of Surveys
To drill or not to drill? An informative unit has scholars first research the advantages and disadvantages of oil drilling in Alaska. They set up and conduct a sample survey to assess attitudes toward oil drilling in a specific...
College Board
2005 AP® Statistics Free-Response Questions
A little context will go a long way. The six released free-response questions from the 2005 exam, show how AP® Statistics uses context within their problems. Pupils use the questions to practice their statistics skills within real-world...
College Board
2016 AP® Statistics Free-Response Questions
Test your classes on their knowledge of advanced statistic concepts. Young math scholars get a sneak peek at the end of course AP® statistics exam with the released items from the 2016 test. The six-question free response exam addresses...
Mathed Up!
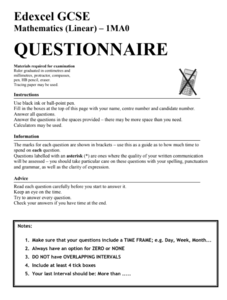
Questionnaires
Check the appropriate box. Class members determine whether a questionnaire is an appropriate one. The portion of the General Certificate of Secondary Education math assessment review requires pupils to create a valid questionnaire to...
Benjamin Franklin Tercentenary
Reading the Work of B. Franklin, Printer
Placing Ben Franklin’s ideas about a free press next to those embodied in the First Amendment sheds light on both. Learners interpret and compare two primary sources and then examine them in the light of a contemporary survey about...
Mathematics Vision Project
Module 9: Statistics
All disciplines use data! A seven-lesson unit teaches learners the basics of analyzing all types of data. The unit begins with a study of the shape of data displays and the analysis of a normal distribution. Later lessons discuss the...
Social Media Toolbox
Social Media Survey
Survey says ... social media is here to stay! How do the pupils in your school use social media? Using lesson four from a 16-part series, The Social Media Toolbox, learners study surveys and create their own. The resource includes...
Kenan Fellows
How Does an Unhealthy Diet Influence our Health and Well-Being?
You are what you eat, or so they say! After surveying family and friends on a week of eating habits, learners analyze the data for patterns. They compare different variables such as fats and cost, fats and calories, or fats and LDLs.
Florida International University
Counting FishStix
How do we count the fish in the ocean? An engaging instructional activity models how to estimate fish populations with observational surveys. Class members begin by studying the behavior of fish on the coral reef in the oceans....


