Curated OER
Graphing Temperatures
Students identify current temperatures for different regions of the United States. Using current information, they develop hypothesis for the temperature in the same region tomorrow. They use the Weather Channel website to find actual...
Curated OER
Fuel Mystery Dis-Solved
Students describe how temperature and surface area exposure affect the rate at which fuel is consumed. They explain why engineers want to know about the properties of a fuel when designing rockets. They create a bar graph of result data.
Curated OER
Animal Science - Body Temperature
Students use the TI-83 + linked to the CBL2 and temperature probes to perform an experiment. Each of the temperature probes is placed into a different cup, one insulated and one not insulated. Each cup holds warm water. The two cups are...
Curated OER
Temperature School
Pupils observ the cooling and warming of room temperature, hot, and ice cold cans of water by measuring the change in temperature over time. They then attempt to develop explanations for the observations made and apply their findings to...
Curated OER
Weather Conditions During the Spring Monarch Migration
Middle schoolers keep detailed weather records during the spring migration of the monarch butterfly. To keep track of the weather, students utilyze weather reports and instuments such as anemometers, compasses, thermometers and rain gauges.
Curated OER
Ice Mummies: Frozen in Heaven
Students conduct an experiment to investigate the rate of microbial growth at different temperatures. Students predict what will happen to the food at various temperature and test their hypotheses. Students describe the differences in...
Curated OER
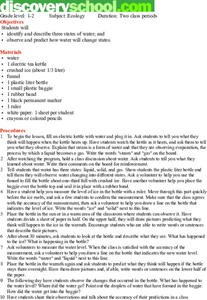
Ecology
Students identify and describe three states of water. They predict how water will change states.
Curated OER
Hotter or Colder
Students participate in an activity in which they determine the temperature. They are given different scenerios and they are to state whether it is hot or cold there and comparing it to other scenerios.
Curated OER
Introducing Temperature Measurement
Students explore temperature and use Celcius thermometers to measure and graph the temperature in the classroom daily. They estimate what they think the temperature might be and then find the actual temperature in the room.
Curated OER
Using Mathematic Models to Investigate Planitary Habitablity
Students examine how the sun's intensity affects the temperature on various planets. They determine whether or not these planets could be habitable. Finally, they factor in the average albedo of the planets to determine whether or not...
Curated OER
Fahrenheit vs Celsius
Learners construct a thermometer and convert Fahrenheit temperature into Celsius temperature. In small groups, they construct a thermometer, write a paragraph describing how to make a thermometer, and convert temperatures.
Curated OER
Understanding Celsius
Student read both Celsius and Fahrenheit temperatures on thermometers. They covert the temperatures and write poems to show understanding.
Curated OER
Believe It...Or Not
Pupils critically analyze data regarding climate changes using a glossary of terms generated by examination of climate related articles. They examine and graph climatic data, and discuss, hypothesize and test apparent discrepancies in...
Curated OER
The Ups and Downs of It: Wind
Students explore the ways in which wind is formed and how it affects our weather.
Curated OER
Exploring Literature and Weather through Chirps
Students explore and experience information about temperature changes by using crickets' chirps to calculate the temperature. The data is applied to formula and the temperatures are calculated.
Curated OER
Ecosystems: What Are They and How Do They Work?
Students explore the characteristics of major ecosystems, the interactions of the organisms within the systems, and the effects of humans on the system. Both living and non-living components are examined in this five lesson unit.
Curated OER
Heating the Atmosphere
Students construct a thermograph for maximum and minimum temperatures for the 2-week period. They illustrate how the earth's atmosphere is heated by convection and conduction currents and evaporation of water.
Curated OER
Effects of Temperature, Deviation on Climate
Young scholars collect and record data for a given city. They calculate standard deviation of temperature and analyze the impact of climate changes on a city's and culture.
Curated OER
Predicting Temperature: An Internet/Excel Learning Experience
Third graders use the Internet (www.weather.com) to find the high temperature for our locale and the high temperature for another city around the world. They keep track of the temperature in these two locations for 10 days.
Curated OER
What Is The temperature?
Young scholars use a thermometer to measure temperature changes. They measure temperatures indoors and out, and graph the information.
Curated OER
When You're Hot, You're Hot!
Eighth graders examine the development of the different temperature scales. They experiment with hot and cold temperatures.
Curated OER
"Show Me" Missouri's Temperatures
Fourth graders gather climate data about cities from each of Missouri's five geographical regions and use technological tools to translate this data into graphs for further analysis and reflection.
Curated OER
Air Temperature and Kinetic Energy
Learners use a NASA website do activities which help them better explain how air temperature and kinetic energy are related to aircraft propulsion.
Curated OER
Introducing Temperature Measurement
Students read a thermometer, associate weather conditions and seasons with temperature changes and keep a record of daily temperature.


