Scholastic
Study Jams! Tools of Measurement
From temperature and mass, to length and volume, there are many different types of measurement. Expose young learners to a variety of measurement tools using this slide show of real-life pictures. Go through the presentation one image at...
Curated OER
Will There Be a White Christmas This Year?
Students examine historical weather data, and create map and color key that illustrates the likelihood of a white Christmas in different locations across the United States.
Curated OER
Moo-Velous Butter!
Third graders investigate how temperature and motion (energy) create a chemical change that turns cream ( a liquid) into butter (a solid). They create a class pictograph of their favorite mils choices (white, chocolate, or strawberry)...
Curated OER
The Fabled Maine Winter
Learners graph and analyze scientific data. In this research lesson plan students use the Internet to obtain data then draw conclusions about what they found.
Curated OER
Radiation Comparison Before and After 9-11
Using the NASA website, class members try to determine if changes could be detected in cloud cover, temperature, and/or radiation measurements due to the lack of contrails that resulted from the halt in air traffic after the attacks of...
Curated OER
Phytoplankton in the Gulf of Maine
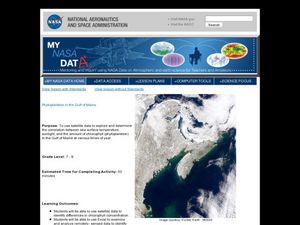
Learners use satellite data to see the correlation between sea temperature and sunlight in the Gulf of Maine. For this phytoplankton lesson students use Excel to analyze data.
Curated OER
Comparing the Effects of El Nino and La Nina
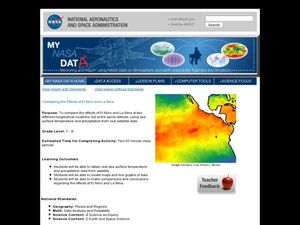
Students examine the differences between an El Nino and La Nina year. For this investigative lesson students create maps and graphs of the data they obtained.
Curated OER
Is Grandpa Right, Were Winters Colder When He Was a Boy?
Students compare current weather data to historic data to see if there is a temperature change. For this weather lesson students complete a lab activity and determine average changes in temperature, precipitation and cloud cover.
Curated OER
Differences Between Ground and Air Temperatures
Students examine the differences between air temperature and ground temperature. In this investigative instructional activity students find NASA data on the Internet and use it to create a graph.
Curated OER
Creating Climographs
Students use satellite data to compare precipitation and surface temperatures on different islands. In this satellite lesson students create graphs and explain the differences between weather and climate.
Curated OER
Comparing Graphs of Temperature and Radiation
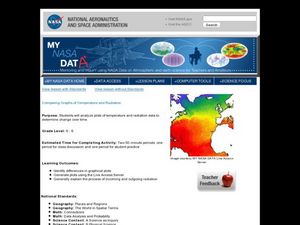
Middle schoolers study plots and use a Live Access Server to generate plots. In this temperature lesson students examine the process of incoming and outgoing radiation.
Curated OER
The Solstices
Compare surface temperatures when the solstice occurs in the different hemispheres. Young scientists draw conclusions from their investigation of data collected using spreadsheets and a globe.
Curated OER
Water Cycle - A SiteMaker Presentation
Have your young scientists explore a single element of the water cycle and write a report to explain findings. Your class can take their writing through all the steps of the writing process and publish it using a Web-based multimedia...
Curated OER
Feeling the Heat
Pupils record temperatures at different locations around campus. They examine the results and draw conclusions about how materials and colors affect the amount of heat produced. They also analyze Los Angeles' temperature records over a...
Curated OER
Calorimetry Problems
In this calorimetry worksheet, students complete 30 problems. They calculate the change in heat of a system given the mass and the change in temperature of the system. Students also find the final temperature of a reaction given the...
Curated OER
Worksheet 3: Earth's Climate System II
A diagram of a mountain range and the prevailing winds is shown at the top of the page. Meteorology pupils describe the weather conditions at different points on the diagram. They explain the El Nino effect and why evaporation and...
Curated OER
Mountains
Mountains are described and some of the more famous listed along with their altitudes. Climate, glaciers, and avalanches are also covered. Because there is a copious amount of text on each slide, this would be best used by assigning...
Curated OER
Surface Area and Volume
Upper graders identify the surface area and attributes of figures that are measurable. They estimate, measure, and record perimeter, area, temperature change, and elapsed time, using a variety of strategies. They also determine the...
Curated OER
WS 7.4 Ideal Gas Law
In this ideal gas law worksheet, students solve eighteen problems using the ideal gas law to solve for moles of gases, temperature of gases, pressure of gases or volumes of gases.
Curated OER
Weather Tools
How do we know so much about the weather? Young scientists will learn all about the various tools used to detect changes in daily weather patterns. Each slide contains illustrations and detailed descriptions of tools, such as a...
Curated OER
Heat Transfer
Answer short answers and fill-in-the-blank questions after reading a briefing of how heat energy is transferred between objects. This straightforward instructional activity can be useful as homework the evening before you do...
Curated OER
It's a Gas! Or is it?
Oceanography enthusiasts are given a series of thought experiments to consider in order to relate the solubility of gases and solids to underwater volcanoes. It is not particularly engaging to perform these thought experiments. Choose...
Curated OER
Daily Weather Calendar
Young learners will love this fun weather activity that incorporates math, science and writing. Each member of your class gets a turn becoming a meteorologist! At the end of recess, the two chosen meteorologists met the teacher at a...
Curated OER
My Angle on Cooling
Students explore how the angle and distance of an object can change it's temperature. After reviewing how the position of the Earth affects the temperature of the planet, student groups design and perform an experiment to test how...


