Curated OER
To stretch or not to stretch
Hands-on is the best way to play. Learners read a graph that shows the force needed to stretch a rubber band. They do this and then participate in a simple experiment where they create coiled springs with wire. They work to determine how...
Curated OER
7th Science Quiz
This seventh grade life science quiz has a professional appearance and well-written multiple-choice questions. However, it seems to cover too broad a variety of biology topics for only 15 questions to fully assess. There is one question...
Curated OER
Comparing School Bus Stats
Engage in a lesson that is about the use of statistics to examine the number of school buses used in particular states. They perform the research and record the data on the appropriate type of graph. Then they solve related word problems.
Curated OER
Interpreting A Line Graph - Practice Problems 15.3
For this interpreting a line graph worksheet, students read a graph and answer a question. Students are taken through the problem solving process by being asked to understand, plan, solve and look back at the end of the worksheet and...
Curated OER
Double Bar Graphs - Homework 7.1
Your learners have seen basic bar graphs, but do they have experience reading double bar graphs? This worksheet details how to draw a double bar graph and provides an example with six accompanying questions. The final question asks...
Curated OER
Use a Graph
Information is often presented in graph form. Can your youngsters read a basic bar or picture graph? Six word problems accompany three graphs. One graph is a bar graph and the other two are pictographs.
Curated OER
Double Bar Graphs - Practice 7.1
In this double bar graph worksheet, students make a double bar graph from given information, then solve related problems in addition to 2 test prep problems. Houghton Mifflin text referenced.
Curated OER
Read a Picture Graph
It's the Bears vs. the Seals! Who is the season winner? Read this data and have your math class answer the six questions that follow. Consider graphing the chart as a class, or encouraging individuals to graph it before answering the...
Curated OER
Bycatch
Bycatch is the unwanted and discarded marine life caught during commercial fishing. Young marine scientists review bycatch litigation and analyze graphs of bycatch data and answer questions about it. This raises awareness while...
Curated OER
Data Analysis: Graphs, Charts, Tables, Statistics
In this data analysis worksheet, students interpret data in 5 problems involving graphs, tables, and scatterplots. Students construct 1 stem and leaf plot and find the mean, median, and mode of a data set.
Curated OER
Creating Graphs
This graphing PowerPoint demonstrates how to use graphs to gather information. The slides contain examples of graphs and display the data clearly. This presentation also gives clear directions on how to construct various graphs by using...
Curated OER
Decisions, Decisions, Decisions
Students examine graphs to find the most appropriate for various kinds of data. In this graphing instructional activity, student create bar, line and circle graphs. Students create graphs electronically and manually interpreting the data.
Curated OER
Religious Book Sales Climb
In this analyzing data worksheet, students review a graph from the USA Today. Students study the graph and answer four questions about the graph. There are also two extension questions included.
Curated OER
Graphs 2
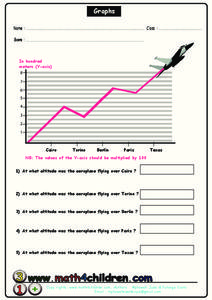
In this graph practice worksheet, students examine a graph and use their problem solving skills on order to respond to 5 questions regarding the information presented on the graph.
Curated OER
Choose an Appropriate Graph
In this graphs learning exercise, students solve 6 fill in the blank problems where they choose the most appropriate type of graph for each set of data and explain why they chose that type. Students use bar graphs, histograms and circle...
Curated OER
English Lesson for Grade 11
Eleventh graders role play a scenario where they have to make a decision. In this english lesson, 11th graders interpret graphs. They research about the life of different historical figures.
Curated OER
Restaurant Income and Expenditure
In this reading a graph worksheet, students analyze a graph and answer comprehension questions.
Curated OER
Profit and Loss
In this reading a graph worksheet, students analyze a graph to determine profit and loss. Students answer comprehension questions about the information in the graph.
Curated OER
Population and Population Density
Students read and interpret graphs. In this population instructional activity, students explore population and population density as they read several data graphs and respond to questions.
Curated OER
My Test Book: Stem and Leaf Plots
In this math skills worksheet, students solve 10 multiple choice math problems which require they interpret a stem and leaf plot. Students may view the correct answers.
Curated OER
Cindy and Linda Selling Lemonade
In this graphing worksheet, learners read a graph, complete a chart about the information, and answer questions. There are fifteen questions in all.
Curated OER
Graphs
In this graph practice worksheet, students examine a graph and use their problem solving skills on order to respond to 5 questions regarding the information presented on the graph.
Curated OER
Insects: Grasshoppers
Students examine grasshoppers as they practice following instructions. In this biology lesson plan, students identify the characteristics of grasshoppers and the functions of grasshoppers' external body parts.
Curated OER
Problem Solving 1
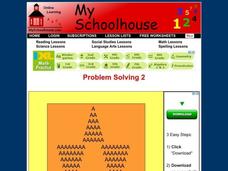
In this online interactive problem solving worksheet, students examine a diagram and use their problem solving skills in order to respond to 5 questions.


