Curated OER
Venn Diagram Dolphins And Whales
In this compare and contrast worksheet, students use a Venn diagram to show similarities and differences in dolphins and whales. There is space for students to write a conclusion.
abcteach
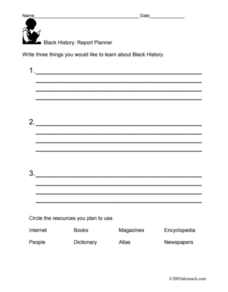
Black History: Report Planner
For this Black History Month worksheet, students list three things that they would like to learn about Black History and choose the resources they plan on using to research the answers to their three questions.
Curated OER
India And Pakistan At 60
Students engage in a lesson that is concerned with the comparison of India and Pakistan. They construct a venn diagram comparing the two while conducting research. There are several extension activities that include a timeline, visual...
Curated OER
Generational Music Communities
Students focus on age-related generations to assess how traditional music is transmitted from one generation to another and how music functions for people within a generation. They compare/contrast and explore music in their own...
Curated OER
Math: Graphs and Their Symbols
Second graders examine different types of graphs and discover the meanings of the symbols used on them. After gathering data about themselves, their communities, and the world, they use that information to create graphs. Among the...
Curated OER
Twisting Versions of Little Red Riding Hood
Students read orally two versions of Little Red Riding Hood (Classic and Cajun) They compare and contrast the two Little Red Riding Hood versions. Students create a concept map to demonstrate the comparisons/contrasts. They could also...
Curated OER
Beef or Dairy?
Guernsey, Jersey, Holstein. Brangus, Charoloais, Herford. Here’s a truly cross-curricular resource that combines language arts, science, math, and visual arts activities as class members learn to distinguish between beef and dairy...
Curated OER
Using Venn Diagrams to Compare Two Ecosystems
Students explore the distribution of two ecosystems on a global scale; and map the distribution of tropical and temperate rain forests throughout the world. They use a Venn Diagram to describe these ecosystems and the differences between...
Curated OER
Comparing Family Photos
Fourth graders bring in a family photo from home. They compare their photo to the Rawding family photo. Students share their conclusions orally. They use Venn Diagrams to organize their thoughts and observations.
Curated OER
ALIKE, DIFFERENT, OR BOTH?
Students compare and contrast two characters from the play The Diary of Anne Frank on a Venn diagram and write a paragraph showing similarities and differences.
Curated OER
Christmas in Other Countries: A Venn Diagramming Activity
Students diagram similarities and differences in Christmas celebrations around the world, and compare and contrast their celebration of Christmas with the celebrations of others.
Curated OER
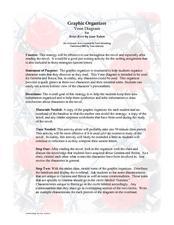
Graphic Organizer: Venn Diagram for Briar Rose
Compare and contrast the characters of Gemma and Becca from Briar Rose. Using a Venn diagram (not included but easy to create), readers will explore the characters. Not much direction or explanation is included here.
Curated OER
Comparing Authors (Venn Diagram)
Need a template for a Venn diagram? This one is designed to show the similarities and differences between two authors. Although no explanations are included, the graphic is self-evident.
Curated OER
Reading Venn Diagrams
Venn diagrams are useful in so many ways. The class views a worksheet to assist them in understanding how to compare two items based on similarities and differences. Children compare four different items using partially completed Venn...
Curated OER
Is the Past Like the Present?
A Venn Diagram worksheet invites young historians to compare life in the past with life in the present for a specific Native American Tribe. As with all Venn Diagrams, the intersecting part in the middle is reserved for things that are...
Curated OER
Venn Diagrams: Write the Expression
In this Venn diagrams worksheet, students write the expression that best suits the Venn diagrams. Students complete 4 problems total.
Curated OER
Gingerbread Baby v. Gingerbread Boy #7
Students read two stories. In this comparison lesson, students read "The Gingerbread Baby," by Jan Brett and the original "Gingerbread Boy." Students use a Venn Diagram to compare and contrast the two stories.
Curated OER
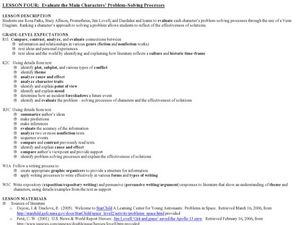
Evaluate the Main Characters? Problem-Solving Processes
High schoolers read passages from several sources and evaluate the text for various criteria. In this problem solving lesson, students evaluate character problem solving processes after reading passages. They will use a Venn Diagram to...
Curated OER
George and Sam Save for a Present
Third graders develop their algebraic thinking by recognizing a variety of patterns using concrete objects, numbers, tables, and pictures. In this George and Sam Save for a present lesson, 3rd graders communicate their mathematical...
Curated OER
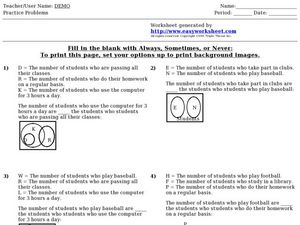
Four Always, Sometimes, or Never Venn Diagram Problems
In this Venn Diagram activity, students fill in the blanks with always, sometimes, or never by reading the Venn diagrams. The variables used in the Venn Diagrams are clearly defined.
Curated OER
Sets: Always, Sometimes, or Never
In this sets worksheet, middle schoolers solve 4 fill in the blank problems. Students determine if the given statement about a diagram is always, sometimes, or never true. Middle schoolers use diagrams to determine which set of people...
Curated OER
Venn Diagram
Young scholars classify items and numbers by using a Venn diagram. In this Venn diagram lesson plan, students use the computer to do this and classify pictures and numbers.
Curated OER
Venn Diagram Comparing Settings
In this Venn Diagram worksheet, learners complete a Venn Diagram of the towns Sparks and Ember from the book Tennessee Blueprint. Students complete 1 Venn Diagram.
Pennsylvania Department of Education
Comparing Two Versions of The Mitten
Students listen to two versions of the story The Mitten and create a chart or a Venn Diagram to compare the two versions. In this literary comparison instructional activity, students create a chart or Venn Diagram and discuss the...


