Center for Innovation in Engineering and Science Education, Stevens Institute of Technology
Ciese: Weather Scope: An Investigative Study of Weather and Climate
The activities in this comprehensive weather unit are designed for Grade 6 and up. Students will use real time data from around the world to conduct an investigation about weather and climate.
Scholastic
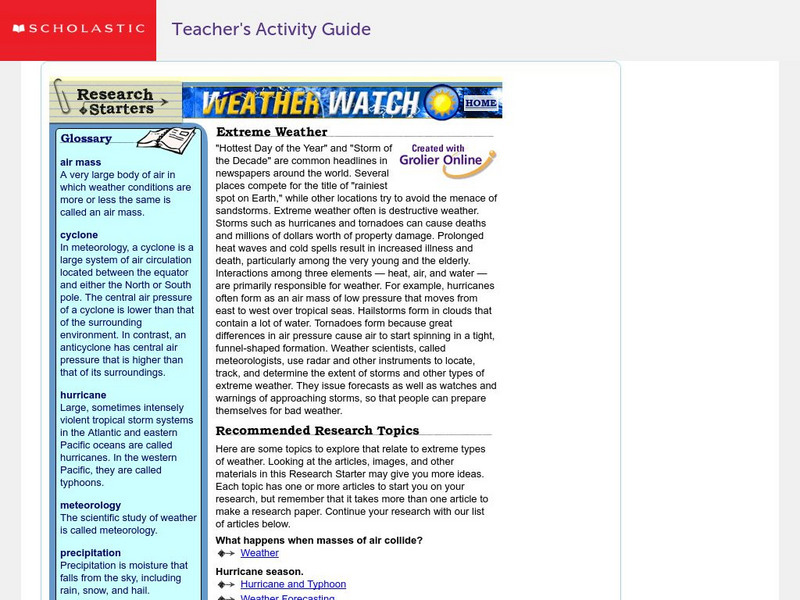
Scholastic: Extreme Weather
Begin your research on extreme weather conditions. View links to other weather related websites and articles.
Geographypods
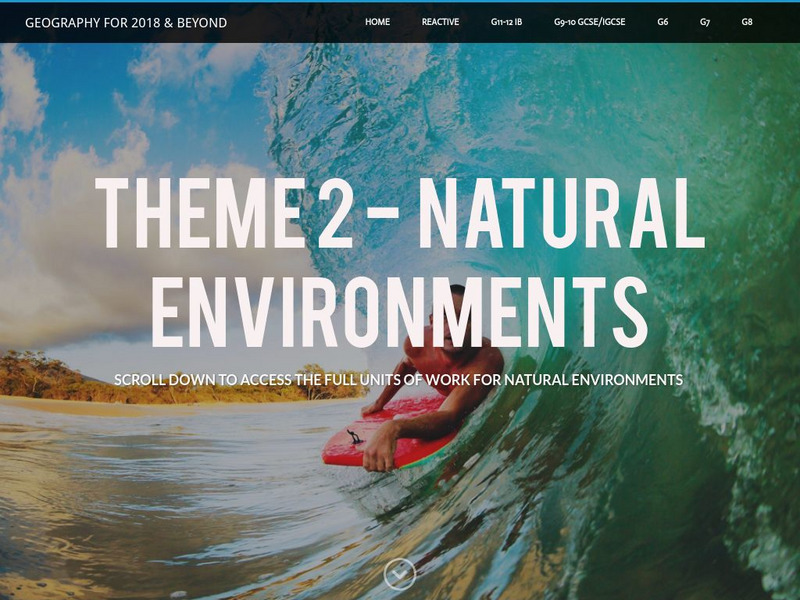
Geographypods: Theme 2: Natural Environments
A rich collection of highly engaging learning modules on topics related to the natural environment. Covers four main areas - plate tectonics, forms and processes, weather and climate, and rainforest and desert. Within each of these,...
NASA
Nasa: Using Radiosonde Data From a Weather Balloon Launch
This lesson plan allows students to learn about the layers of the atmosphere and to learn how to graph real atmospheric data.
University of Texas at Austin
University of Texas: Hurricane Rita Maps
Web page with a large quantity of links to information on Hurricane Rita including maps, aerial images, satellite images, data, and much more.
Center for Innovation in Engineering and Science Education, Stevens Institute of Technology
Ciese Real Time Data Projects: Weather Scope: A Study of Weather and Climate
Use real-time data to study factors that affect weather and climate, create weather instruments, and share data with students around the world.
Scholastic
Scholastic: Gather Data: Experiment With Weather
Simple guidelines for building several weather-related tools: anemometer, wind vane, barometer, rain gauge, snow gauge, and thermometer. After building your tools, follow experiment steps and record your findings on the Scholastic...
Center for Innovation in Engineering and Science Education, Stevens Institute of Technology
Ciese Real Time Data Projects:collecting Weather Data and Keeping a Weather Log
Over a period of two weeks students will use their class-made instruments to measure and record weather data. Students will also compare their data to online weather data. The final activity involves analyzing the collected data to look...
Center for Innovation in Engineering and Science Education, Stevens Institute of Technology
Ciese Navigational Vectors
For this project, students use real time data to learn how pilots navigate when they fly. Students go through a series of lessons on vectors, weather maps and flight tracking, then take a pilot's test where they apply what they have...
Other
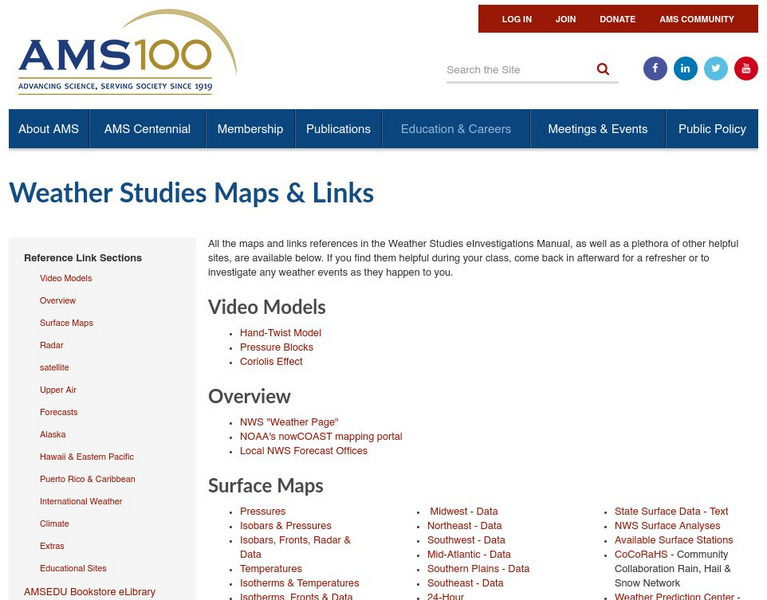
American Meteorological Society: Data Streme Atmosphere
This site provides an extensive amount of weather information. Includes current information, forecasting, and historic weather related events. Weather map symbols and terminology explained.
Utah Education Network
Uen: Trb 4:2 Investigation 8 Weather Forecasts
Learn how to predict and evaluate weather forecasts.
Scholastic
Scholastic: Analyze: Forecast the Weather
Choose a weather-related topic, view the map, then make your own weather forecast.
Science Education Resource Center at Carleton College
Serc: Exploring and Animating Goes Images
Students learn how to transform a series of GOES images into an animation, and how to create a storm track from that animation. By synthesizing information from the track and other sources, students determine storm speed and direction.
Science Education Resource Center at Carleton College
Serc: How Does the Temperature of the Great Lakes Change Over Time?
This activity allows students to use water surface temperature, bathymetric data, and weather data to look at trends in the water temperature of the Great Lakes.
Center for Innovation in Engineering and Science Education, Stevens Institute of Technology
Ciese: Wonderful World of Weather Project
If you're studying the weather, this is an excellent project for students to develop their understanding of how weather is measured. They will use real time data from their location as well as from around the world to learn about weather...
PBS
Pbs Teachers: Weather: Wind Chill
Explore the effect of the combination of temperature and wind speed on human comfort. Use a formula to compute the Fahrenheit wind chill for a specific wind speed on a specific temperature.
PBS
Pbs Teachers: Weather: Temperature Measurement
In this activity, students learn how to convert measures of temperature between the three different scales - Fahrenheit, Celsius and Kelvin. The history and uses of each are very briefly explained as well.
Science Education Resource Center at Carleton College
Serc: In Search of Globe Data
Students use GLOBE search tools to locate and display data from schools, and then use the data to answer questions regarding weather and climate.
Utah Education Network
Uen: Weather Walks
In this multi-day, students will learn weather through multisensory approaches. Students will make daily predictions. After each daily prediction, they will collect measurement and observational data by taking walks in different types of...
NOAA
Noaa: Outflux: City Climate Comparisons
An interactive comparable climate data tool where the user chooses from a list of United States cities and several weather factors. The immediate result is a graph or graphs of historical US city data.
Other
Bright Hub: Technology Used to Collect Weather Data
Technology used to collect weather data employs a number of devices such as satellites and weather balloons to perform a very important function to our daily living; forecasting the weather.
NASA
Nasa Earth Observatory: Should We Talk About the Weather?
Discover how scientists use the BOREAS to gather data such as heat, carbon dioxide, water vapor, and more to see what role these levels have on climate changes.
Illustrative Mathematics
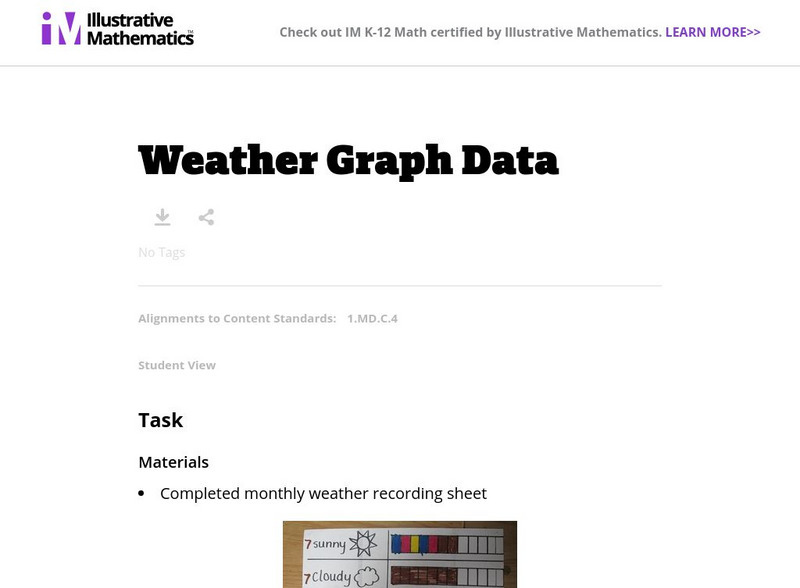
Illustrative Mathematics: Weather Graph Data
The purpose of this task is for students to represent and interpret weather data, as well as answer questions about the data they have recorded. Student worksheets and recording sheet are included.


