Curated OER
Average of Numbers Worksheet
In these mathematical worksheets, students complete six pages of number sentences wherein they find the average of a set of five numbers. Students must print out their completed worksheets to save their progress.
Curated OER
Multiplication Fifty Facts 5
In this multiplication facts worksheet, students solve 50 different problems that include multiplying the numbers 1-10. They complete 50 multiplication facts in a given amount of time for practice. They include multiplying all of the...
Curated OER
Quiz: Central Tendency and Dispersion
In this central tendency and dispersion worksheet, students find the mean, median and mode of a set of numbers. The set of numbers is not included on this worksheet. They complete a frequency distribution and find the modal interval.
Curated OER
Bar Graphs 1
In this mathematics worksheet, 4th graders create a frequency table and a bar graph illustrating the results of the problem described. Then they find the average of the hours and favorite color for each word problem.
Curated OER
Mean, Median, Mode and Range Sheets
For this math worksheet, students use the graphic organizer to display their answers when learning about measures of central tendency. There are 4 boxes: mean, median, mode and range.
Curated OER
Hypothesis Testing: Claim on Mean; Population Standard Deviation Known
In this standard deviation worksheet, students are given statistical data in a story problem. They use a level of significance to test the claim given by the data. This worksheet contains three problems.
Curated OER
Sampling Distribution and Estimators Section 6.4
In this distribution worksheet, learners examine given situations, determine the probability of an event, identify the standard deviation, and find a specified percentile and quartiles. Five probability story problems are available on...
Curated OER
TAAS Attack Daily Upkeep #7
In this word problem worksheet, 5th graders review various mathematical terms by selecting the correct letter that answers each question completely. There are a total of 13 math problems to solve which vary between word problems,...
Curated OER
Mean, Median, and Mode
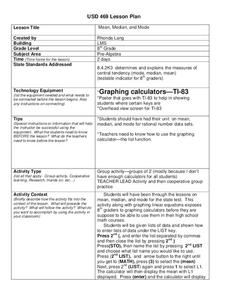
Eighth graders practice using the LIST key on graphing calculators using the proper syntax. They work with the functions of mean, median, and mode in a teacher led lesson and then with a partner on a second data set. They follow...
Curated OER
Fly Away With Averages
Students discover the process of finding the mean, median, and mode. Through guided practice and problem solving activities, they use a computer program to input data and create a graph. Graph data is used to calculate the mean,...
Curated OER
Fly Away With Averages
Students study mean, median, and mode. They construct paper airplanes and test them to see how far they fly. They measure the distance and then find the averages of their throws. They use spreadsheet software to record the data in a...
Curated OER
Probability Review
High schoolers engage in a lesson that is concerned with the concepts related to probability. They review the key properties of statistics involved in the measurement of probability that includes mean, median, and mode. The lesson...
Curated OER
Univariate Data Analysis
Young scholars use given data to compare baseball players. They create box and whisker plots to compare the players and determine which they feel is the best player. Students use calculators to make box and whisker plots. They write...
Curated OER
Civic Engagement: Community and Social Action
Explain that today's project is that students will get groups create a survey to poll their classmates on what they do to stay healthy. The results will then be shown on a bar graph.Students brainstorm ways of keeping healthy and teacher...
Curated OER
Sales Leader
Students examine a set of data based on a realtor's sales for a specific amount of time. Using this information, they calculate the mean, mode and median and how to skew the data to different points of view. They determine which...
Curated OER
Using Averages to Create Graphs Through Excel
Sixth graders create and use a spreadsheet to make graphs which will be used to analyze Progress Report and Final Report Card grades. They practice finding the mean, median, mode, and range of a data set. Students also incorporate column...
Curated OER
Flavorful Spreadsheets
Pupils create a spreadsheet which includes a bar graph. They sort and classify information and use the average function on a spreadsheet. They research Skittles candy and summarize their findings on a spreadsheet.
Curated OER
What Happens on Average
Fifth graders are introduced to convergence of sequences based on averaging previous terms in the sequence. The power of the "fill-down" function in spreadsheets is exploited. By using various starting numbers, and inferring the limit,...
Curated OER
Bones and Math
students identify and explore the connection between math and the bones of the human body. Students collect data about bones from their classmates and from adults, apply formulas that relate this data to a person's height, and organize...
Curated OER
Not Your Average Average
Students discover that if a distance is traveled in two or more segments at different average speeds, you cannot average the average speeds. Instead the total distance traveled must be divided by the total elapsed time. Students practice...
Curated OER
Shooting Stats
Eighth graders discover the important role statistics play in sports and that appropriate data must be collected to do a statistical analysis. Students practice calculating statistics by charting a professional player of their choice.
Curated OER
Finding Averages
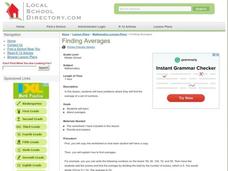
Students have problems in the lesson where they need to find the average of a set of numbers. As a class, they work a few problems and then independently complete a worksheet practicing their new skill.
Curated OER
A RealSim Surface Look at Descriptive Statistics
Students explore the concepts of mean and variance. They observe properties of materials to their basic atomic or molecular structure. Students use spreadsheet software to record, tabulate and analyze collected information.
Curated OER
Basketball Caps
Students work on a problem, individually or in pairs. They are asked questions that focus on average. They discus that the average number represents an equal redistribution , rather than just being able to state the rule. They write...


