Curated OER
Find the Mean #1
For this numbers worksheet, students study 8 sets of numbers and determine the mean for each set. Students write their answers in the boxes provided.
Curated OER
Find the Mean #1
In this numbers worksheet, students study 8 sets of whole numbers and determine the mean for each set. Students write their answers in the boxes provided.
Curated OER
Find the Range #5
In this mathematics worksheet, students view 6 different sets of numbers. Students, for each set of numbers, find the mean, mode, median and range. Students place their answers in the boxes provided.
Curated OER
Find the Mean, Median, Mode & Range
In this numbers worksheet, learners study 6 different sets of numbers. Students, for each set of numbers, find the mean, median, mode and range. Learners put their answers in the boxes provided.
Curated OER
Find the Range #2
In this finding the range worksheet, students find the mean, median, mode, and range of each of six number sets. They write the answers in the boxes next to each label.
Curated OER
I Breath What? Activity-Pollution Detector Worksheet
In this pollution worksheet, students collect particles using a pollution detector and then observe their results under the microscope. They calculate the average number of particles collected in three different locations. They draw...
Curated OER
Range, Mean, Median, and Mode
Eighth graders find the range, median, mean, and mode of a data set. In this finding the range, median, mean, and mode of a data set lesson, 8th graders collect data about the high and low temperature for 10 different cities. Students...
Curated OER
Range, Mean, Median and Mode Through the Internet
Middle schoolers compute measures of central tendency. In this range, mean, median and mode lesson, students gather information on the internet, organize the data and then compute the measures of central tendency. They create a...
Curated OER
#3 Differential Calculus
Learners create models of the Mean Value Theorem. In this Mean Value lesson plan, students use their knowledge of derivatives and exponential functions to explore the Mean Value Theorem. They illustrate the meaning of the throrem,...
Curated OER
Dealing with Data in Elementary School
Students follow the scientific method in collecting data. In this following the scientific method in collecting data instructional activity, students develop a question they would like answered such as how many aluminum cans are consumed...
Curated OER
Global Warming Statistics
Learners research and collect data regarding temperature changes for a specific location and find the mean, median, and mode for their data. In this climate change lesson plan, students choose a location to research and collect data...
Curated OER
Shedding Light on the Weather with Relative Humidity
Learners study weather using a graphing calculator in this lesson plan. They collect data for temperature and relative humidity for every hour over a day from the newspaper, then place the data in their handheld calculator and examine it...
Curated OER
The Air Up There
In this data collection and analysis activity, learners observe and graph the weather conditions during one school week, then calculate the average weather temperature. Extensions are included.
Curated OER
An "Average" Golf Score
Ninth graders investigate mean, median, and mode. In this mean, median, and mode lesson, 9th graders research gold data for the top ten scores in two golf tournaments. Students make tables and graphs of the data. Students determine...
Curated OER
Excel for Beginners
In this Excel lesson, learners set a formula to check their homework. Students also use clipart, work in groups, and learn to use the tools in the drop-down list.
Curated OER
Atlatl Lessons Grades 4-12: Lesson for Beginning Users of Atlatl
Sixth graders determine the mean, range median and mode of a set of numbers and display them. In this data activity students form a set of data and use computer spreadsheet to display the information. They extend of the process by...
Curated OER
A Trillion Here...A Trillion There
In this working with large numbers learning exercise, students are given the finance statistics for the US and the world for the 2006-2007 year. Students solve 11 problems including finding averages and percentages for the given...
Alabama Learning Exchange
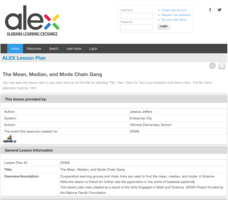
The Mean, Median, and Mode Chain Gang
Students analyze a set of data. They work in cooperative groups and use chain links to identify the mean, median, and mode of the chain.
Curated OER
Inequalities and Measures of Central Tendency
In this inequality and measures of central tendency instructional activity, students solve and graph linear inequalities. They organize given data to identify the mean, mode and range. Students interpret box-and-whisker plots. This...
Curated OER
What is an Average?
In this averages worksheet, students practice finding the averages of numbers. They use a chart with data to find the average number of wildfires in four states between 1993 and 1996.
Curated OER
Average, Mode, and Median
For this average, mode and median worksheet, students learn how to determine each of these values and practice finding all three. They are given a table of different falcon flight speeds and they calculate the average, mode and median...
Curated OER
Leveled Problem Solving: Experimental Probability
For this using probability to solve word problems worksheet, students use statistics, averages, and even numbers, to problem solve. Students solve six problems.
Curated OER
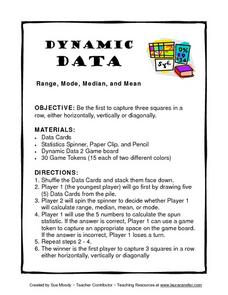
Dynamic Data Range, Mode, Median, and Mean
In this lesson, Dynamic Data Range, Mode, Median, and Mean, students play a game while figuring range, mode, median, and mean. Students spin for their task, figure the mode, mean, median or range of a row of numbers and gain a space on...
Curated OER
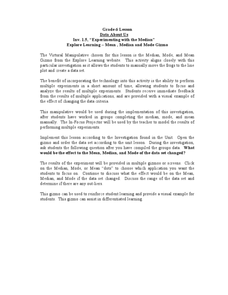
Explore Learning - Mean , Median and Mode Gizmo
Sixth graders experiment with mean, median, and mode. In this online interactive mean, median, and mode lesson, 6th graders analyze the results of multiple experiments and after they work in groups completing the median, mode, and mean...


