PBS
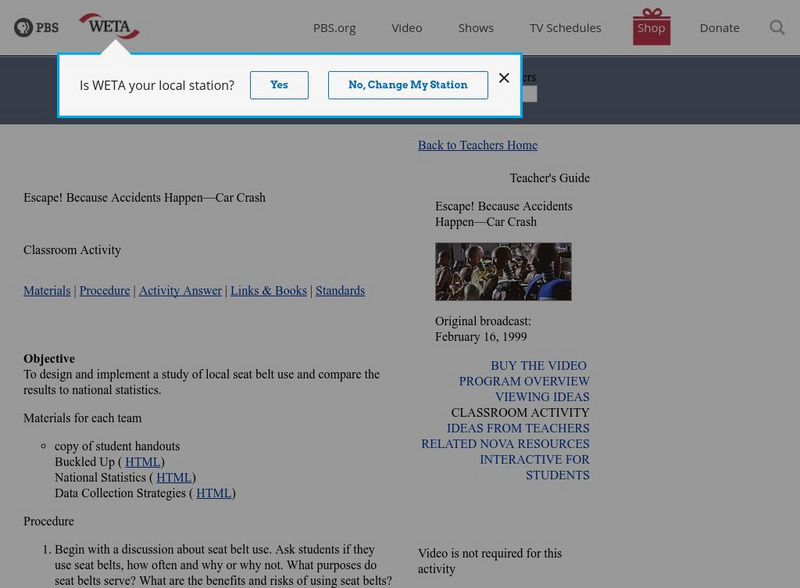
Pbs Teachers: Escape! Because Accidents Happen: Car Crash
Examine the benefits and risks of using seat belts and analyze national statistics on seat belt use. Design and implement a study of local seat belt use and compare the results to the national statistics.
The Franklin Institute
Frankin Institute Online: Group Graphing
This site from The Franklin Institute explores how to make a simple graph using a spreadsheet to portray survey data. It also gives a set of interesting sports-related web sites so that students can get statistical inforamtion.
ABCya
Ab Cya: Fuzz Bugs Graphing
Students drag the fuzz bugs into the correct container to create a bar graph that is used to compare data.
TeacherLED
Teacher Led Interactive Whiteboard Resource Survey
Students can explore surveys, pie charts, and bar graphs with this interactive white board resource.
CK-12 Foundation
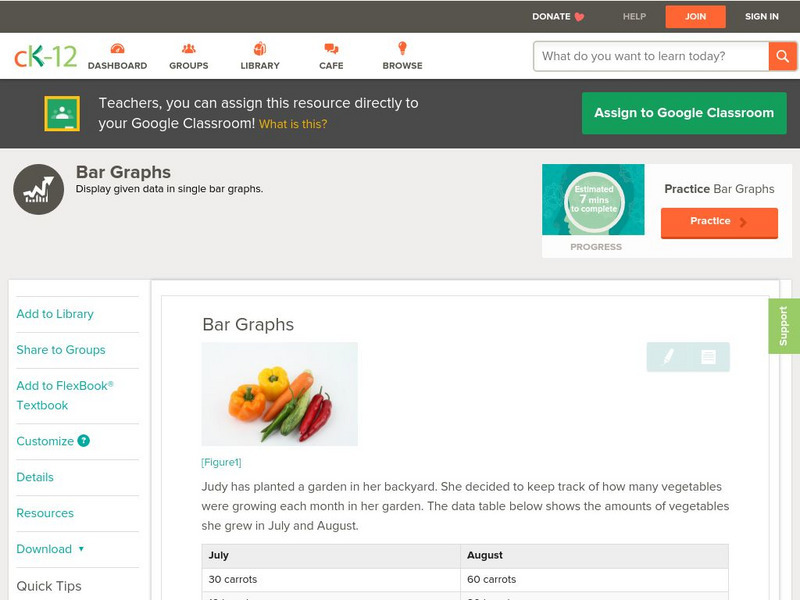
Ck 12: Statistics: Bar Graphs Grade 6
[Free Registration/Login may be required to access all resource tools.] Create a bar graph to display given data.
CK-12 Foundation
Ck 12: Statistics: Bar Graphs Grade 7
[Free Registration/Login may be required to access all resource tools.] Make a bar graph to display given data.
CK-12 Foundation
Ck 12: Statistics: Bar Graphs Grade 8
[Free Registration/Login may be required to access all resource tools.] Students will interpret data to understand given bar graphs.
CK-12 Foundation
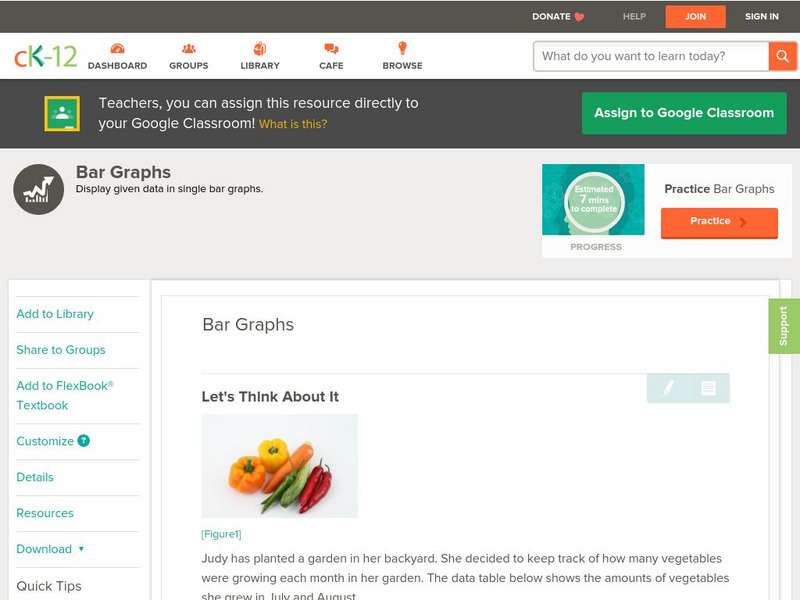
Ck 12: Statistics: Bar Graphs Grades 9 10
[Free Registration/Login may be required to access all resource tools.] Make a bar graph to display given data.
CK-12 Foundation
Ck 12: Statistics: Double Bar Graphs Grades 9 10
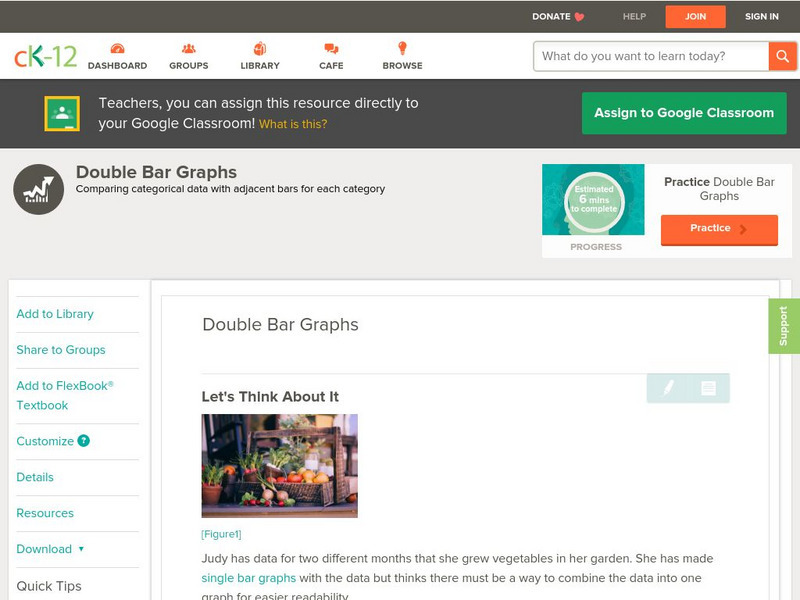
[Free Registration/Login may be required to access all resource tools.] Covers double bar graphs.
National Center for Ecological Analysis and Synthesis, University of California Santa Barbara
Nceas: Graph Types
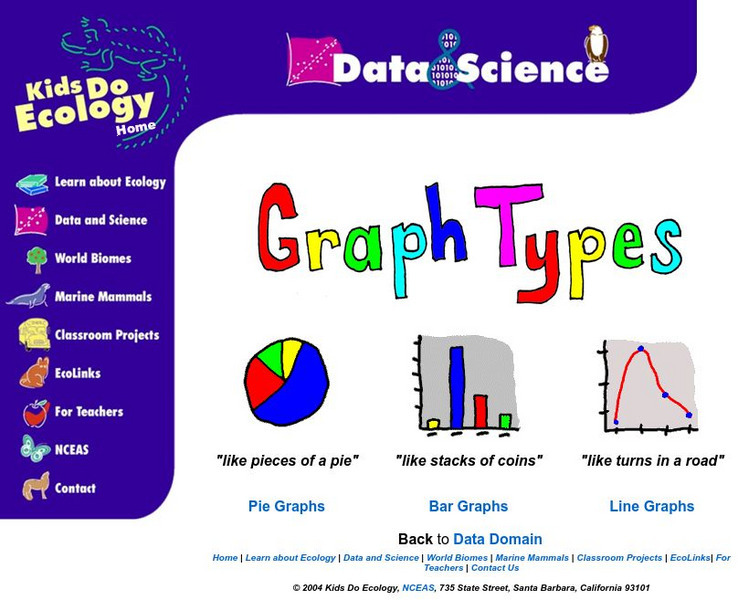
At this site from NCEAS you can learn how to organize your data into pie graphs, bar graphs, and line graphs. Explanations and examples are given of each graph along with several questions that check comprehension.
Khan Academy
Khan Academy: Create Bar Graphs
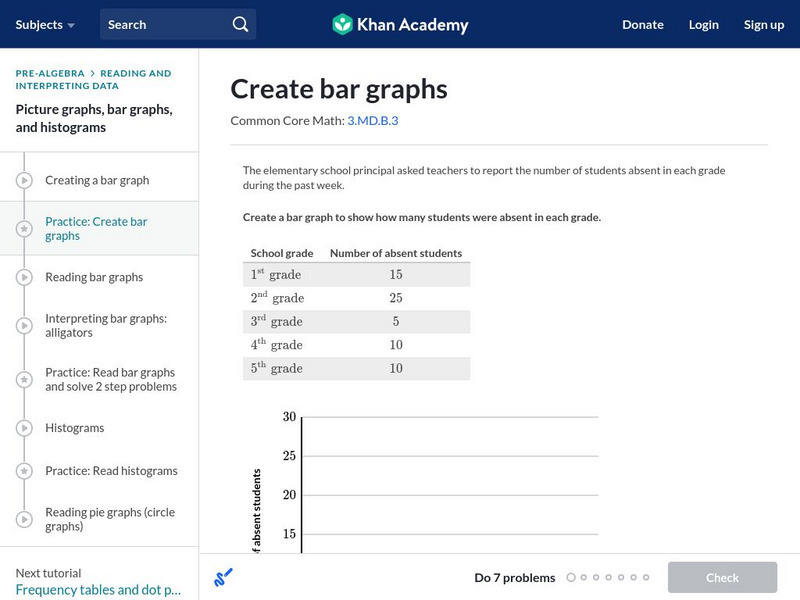
Create a bar graph with the data given. Students receive immediate feedback and have the opportunity to try questions repeatedly, watch a video tutorial, or receive hints about creating bar graphs. CCSS.Math.Content.3.MD.B.3 Draw a...
Khan Academy
Khan Academy: Make Line Plots
Practice creating line plots (dot plots) from data sets. Students receive immediate feedback and have the opportunity to try questions repeatedly, watch a tutorial video, or receive hints.
Khan Academy
Khan Academy: Read Bar Graphs and Solve 2 Step Problems
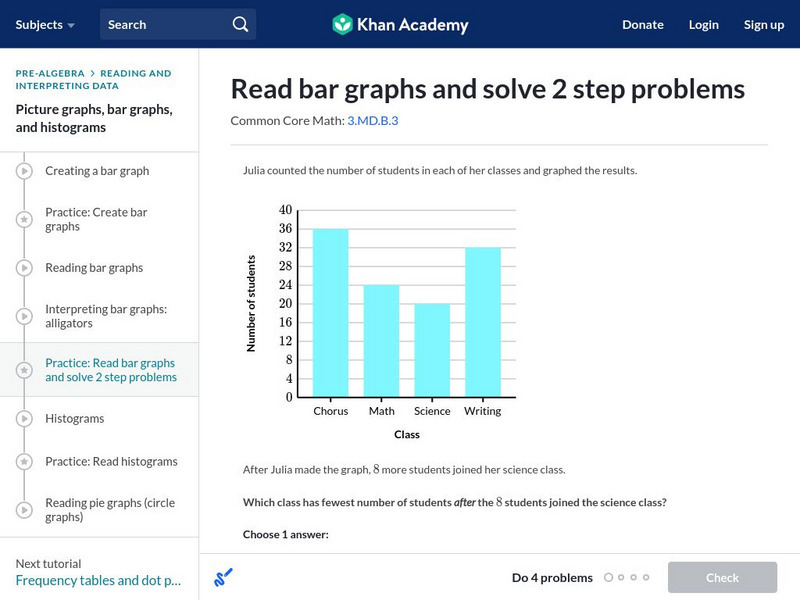
Read and interpret a double bar graphs. Students receive immediate feedback and have the opportunity to try questions repeatedly, watch a video or receive hints. CCSS.Math.Content.3.MD.B.3 Draw a scaled picture graph and a scaled bar...
Khan Academy
Khan Academy: Solving Problems With Bar Graphs 2
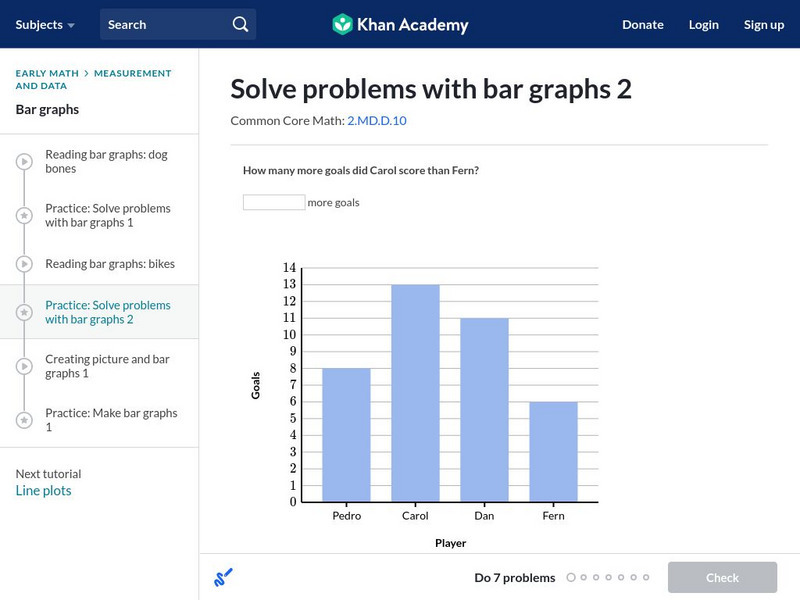
In this exercise, students practice solving problems with bar graphs. Students receive immediate feedback and have the opportunity to get hints, watch a tutorial video, and try questions repeatedly.
Khan Academy
Khan Academy: Solve Problems With Bar Graphs 2
Use bar graphs to solve addition and subtraction word problems. Students receive immediate feedback and have the opportunity to try questions repeatedly, watch a tutorial video, or receive hints.
Other
Basket Math Interactive
Explore more than twenty math concepts such a perimeter, rounding, exponents, decimals, sign numbers, and more using this interactive basketball game. A Spanish version is also offered. Students results are tabulated daily.
Illustrative Mathematics
Illustrative Mathematics: Color Week
Five-year-olds need to count things that relate to them. This activity builds on their need to be included or see the relevance of their counting. Students will practice counting, writing numbers, and filling in a chart or bar graph....
Texas Education Agency
Texas Gateway: Analyze Graphical Sources: Practice 2 (English I Reading)
You will look at each of these types of graphs: bar graph, line graph, pie charts, as you work your way through the lesson.
CK-12 Foundation
Ck 12: Statistics: Displaying Categorical Variables
[Free Registration/Login may be required to access all resource tools.] This Concept covers a few ways in which categorical data can be displayed; using bar graphs and pie graphs.
Better Lesson
Better Lesson: Graphing Our Snack Mix: Review of Graphing
Second graders review how to make bar graphs, line plots, and pictographs by tallying the contents of snack mix and building graphs to show their data.
Better Lesson
Better Lesson: Something's Fishy Working With Bar Graphs
In this lesson, students continue to build their graphing skills. This lesson also reinforces important mathematical skills like counting and comparing.
PBS
Pbs: The Lowdown: u.s. Gun Homicides: Visualizing the Numbers
Explore firearm deaths in the United States in 2010 by type, race, and age group in this interactive from KQED. In the accompanying classroom activity, students are presented with a simple question: Is America a safe place to live? In...
PBS
Pbs Learning Media: Graphs, Charts, and Tables: Targeted Math Instruction
At the end of this lesson about graphs, charts, and tables, students will be able to interpret and compare data from graphs (including circle, bar, and line graphs), charts, and tables.
E-learning for Kids
E Learning for Kids: Math: Pizza (Italian) Restaurant: Data and Chance
In this interactive site, students practice with bar and picture graphs by helping a pizza place collect and analyze their data.


