E-learning for Kids
E Learning for Kids: Math: Pizza (Italian) Restaurant: Data and Chance
In this interactive site, students practice with bar and picture graphs by helping a pizza place collect and analyze their data.
E-learning for Kids
E Learning for Kids: Math: Traditional African Village: Bar Graph and Data
Help Kyan make a bar graph with the ages of the children in his village.
E-learning for Kids
E Learning for Kids: Math: Music / Dance Performance: Data and Chance Experiments
On this interactive site students use the setting of a dance performance to predict all possible outcomes and make vertical and horizontal bar graphs.
E-learning for Kids
E Learning for Kids: Math: Dinosaurs: Data and Chance
Students can play learning games to explore how to label, read, and create graphs using a dinosaur theme.
E-learning for Kids
E Learning for Kids: Math: Elephant Plant: Data and Graphs
On this interactive website students practice various math skills using a real-life scenario involving plants. Those skills include interpreting data in a circle graph, interpreting data in a divided bar graph, and interpreting a bar...
National Council of Teachers of Mathematics
The Math Forum: How to Make a Bar Graph
Site contains specific directions for making bar graphs using a Claris Works spreadsheet file.
Scholastic
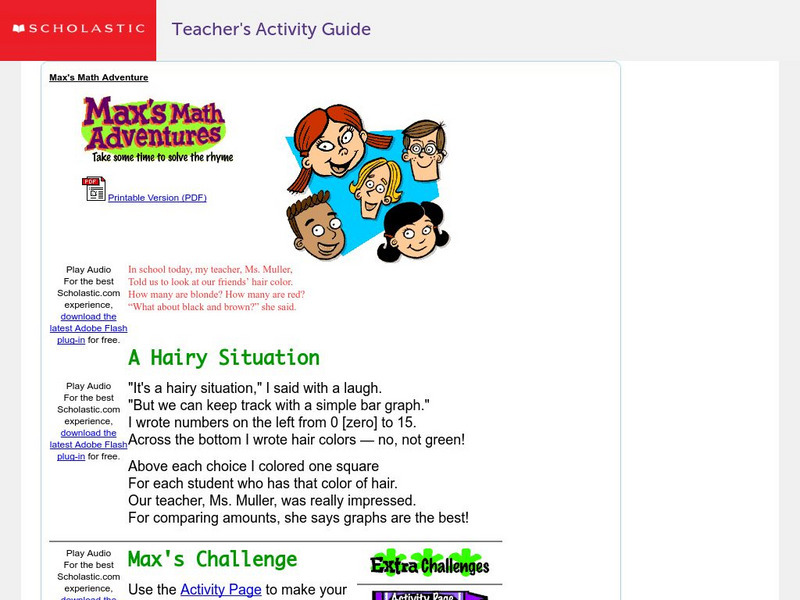
Scholastic: Max's Math Adventures: A Hairy Situation
Help Max make a bar graph to show the hair colors of his classmates. Teachers will appreciate the activities with bar graphs in the extra challenges. Use the teacher's guide to create a fun and engaging lesson.
ClassFlow
Class Flow: Using Graphs in History Class
[Free Registration/Login Required] This flipchart covers the major types of graphs used in social studies such as bar graphs, line graphs, pie graphs, and pictographs. Information on graphs is followed by graphs dealing with salaries...
ClassFlow
Class Flow: Witches Brew
[Free Registration/Login Required] This flipchart concentrates on subtraction but uses a wide variety of teaching strategies to help students understand subtraction. The clever theme keeps their attention and problems are stated in...
ClassFlow
Class Flow: Types of Graphs
[Free Registration/Login Required] This flipchart explores the use of graphs. Bar graphs, tables and circle graphs are discussed.
ClassFlow
Class Flow: End of Year Review Grade 4
[Free Registration/Login Required] This flipchart encompasses all the skills learned in grade 4. It's a collaboration of practice and review to do whole group, independently, or using the votes.
ClassFlow
Class Flow: Graphing
[Free Registration/Login Required] Students will identify pictographs, bar graphs and circle graphs.
ClassFlow
Class Flow: Graphing Graphs
[Free Registration/Login Required] Standard: Constructs and Interprets simple bar graphs and pictographs with up to 5 columns using whole unit data.
ClassFlow
Class Flow: Graphs
[Free Registration/Login Required] This flipchart presents bar and double bar graphs, line and double line graphs, pictographs, histograms, and circle graphs with review activities and web links for practice.
University of Cambridge
University of Cambridge: Nrich: The Pet Graph
On this one-page website, sharpen your logic and graph reading skills by figuring out which pet goes with each bar on the graph. The solution is available to double check your own solution.
Wolfram Research
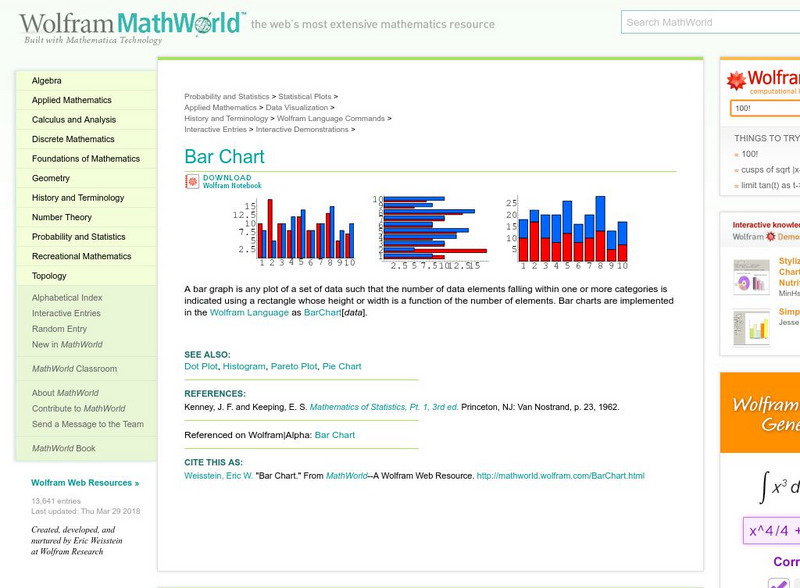
Wolfram Math World: Bar Chart
MathWorld offers a definition and example of the math term, "bar chart."
University of Illinois
University of Illinois: Rollin' Rollin' Rollin'
This resource is the beginning of a series of pages that demonstrates the diffference between the mean and median of a group of numbers. Uses bar graphs to display the data.
University of Illinois
University of Illinois: Rollin' Rollin' Rollin'
This page from the University of Illinois is the beginning of a series that demonstrates the difference between the mean and median of a group of numbers. The sites use bar graphs to display the data.
Education Place
Houghton Mifflin: Eduplace: Make a Living Bar Graph
Student use simple data to line up in a living bar graph activity when they respond to simple questions in this lesson plan. They physically and visually represent the data. CCSS.Math.Content.3.MD.B.3 Draw a scaled picture graph and a...
University of Illinois
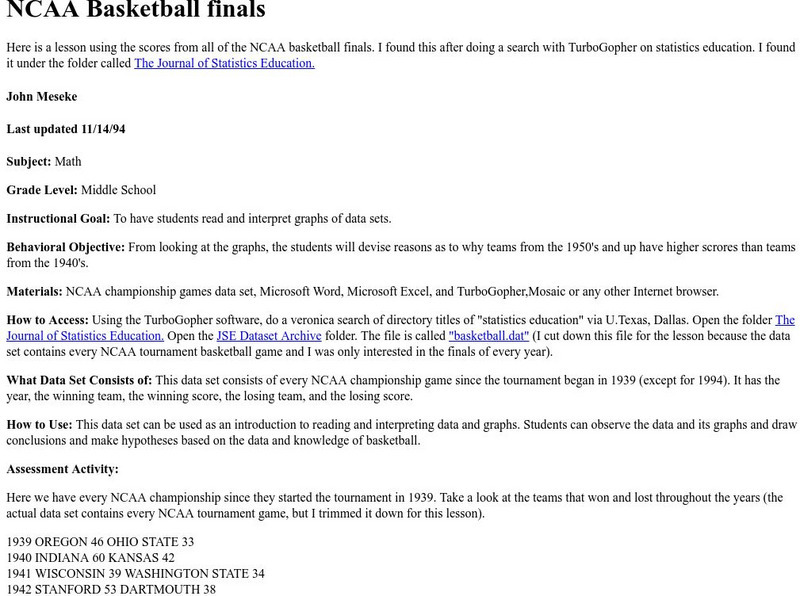
University of Illinois: Ncaa Basketball Finals Bar Graphs
Site from University of Illinois contains a lesson plan that utilizes the NCAA Basketball Final Scores from 1939-1994. Students are instructed to analyze and interpret data displayed in bar graphs.
Cyberbee
Adventures of Cyberbee: Math on the Web (Web Quest)
Site from Adventures of Cyberbee offers math related web quests. These web quests contain many challenging activities.
Math Aids
Math Aids: Graph Worksheets
Great resource to practice and strengthen math skills pertaining to graphs. Math worksheets are printable, may be customized, and include answer keys.
University of Illinois
University of Illinois: Bar Graphs
Two bar graph examples are shown and explained at this website. You can learn what kind of data is best represented using a bar graph.


