Curated OER
A Trillion Here...A Trillion There
In this working with large numbers worksheet, students are given the finance statistics for the US and the world for the 2006-2007 year. Students solve 11 problems including finding averages and percentages for the given statistics and...
Alabama Learning Exchange
The Mean, Median, and Mode Chain Gang
Students analyze a set of data. They work in cooperative groups and use chain links to identify the mean, median, and mode of the chain.
Curated OER
Graphing Logarithms
In this logarithms worksheet, students identify the domain and range of given logarithms. They sketch the graph on a coordinate plane. This four-page worksheet contains 12 multi-step problems. Answers are provided on the last two pages.
Curated OER
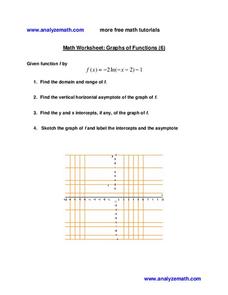
Graphs of Functions
In this graphs of functions instructional activity, students identify the domain and range of a function. They determine the vertical horizontal asymptote and find the y and x intercepts. Students sketch a graph of the function. This...
Curated OER
Inequalities and Measures of Central Tendency
In this inequality and measures of central tendency worksheet, students solve and graph linear inequalities. They organize given data to identify the mean, mode and range. Students interpret box-and-whisker plots. This three-page...
Curated OER
What is an Average?
In this averages worksheet, students practice finding the averages of numbers. They use a chart with data to find the average number of wildfires in four states between 1993 and 1996.
Curated OER
Average, Mode, and Median
In this average, mode and median worksheet, students learn how to determine each of these values and practice finding all three. They are given a table of different falcon flight speeds and they calculate the average, mode and median for...
Curated OER
Bikini Bottom Olympics Skill: Best Value and Uncertainty
In this best value and uncertainty activity, learners solve multiple problems where they calculate the best value, the uncertainty and the range in the data given.
Curated OER
Leveled Problem Solving: Experimental Probability
In this using probability to solve word problems activity, students use statistics, averages, and even numbers, to problem solve. Students solve six problems.
Curated OER
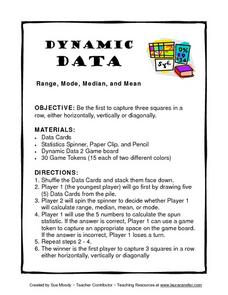
Dynamic Data Range, Mode, Median, and Mean
In this lesson, Dynamic Data Range, Mode, Median, and Mean, students play a game while figuring range, mode, median, and mean. Students spin for their task, figure the mode, mean, median or range of a row of numbers and gain a space on...
Curated OER
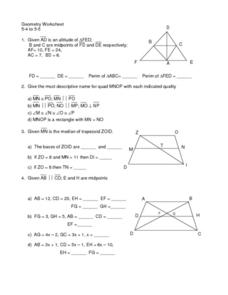
Midpoints
In this midpoints worksheet, 10th graders solve and complete 10 different problems. First, they find the perimeter of each illustrated triangle. Then, students determine the bases and median of a trapezoid. They also prove that two lines...
Curated OER
Right Triangles
In this right triangles worksheet, 10th graders solve and complete 14 various types of problems. First, they find the perimeter of the isosceles trapezoid shown. Then, students find the measures of each marked side of a right triangle....
Curated OER
Triangles
In this triangles worksheet, 10th graders solve and complete 6 various types of problems. First, they draw a median and the altitude from the given angle in each triangle illustrated. Then, students determine which angle is equidistant...
Curated OER
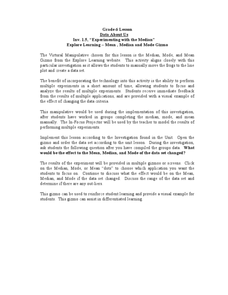
Explore Learning - Mean , Median and Mode Gizmo
Sixth graders experiment with mean, median, and mode. In this online interactive mean, median, and mode lesson, 6th graders analyze the results of multiple experiments and after they work in groups completing the median, mode, and mean...
Curated OER
Madley Brath #39 - Stem and Leaf Plots, Mean, Median, Mode and Range
For this measures of central tendency worksheet, students draw a stem and leaf plot of a set of test scores. They compute the mean, median, mode, and range of the data set, and round the answers to the nearest tenth.
Curated OER
Algebra 1: Unit 5 Review
For this problem solving worksheet, 6th graders determine if 4 functions are exponential growth or decay, sketch 4 graphs and compare 2 sets of functions. Students write the rule, linear or exponential, for 4 tables.
Curated OER
Project Interactive--Stem and Leaf Plotter
In this excellent stem and leaf plotter worksheet, students construct, arrange and write a report of how to interpret the leaves they collect in this data analysis. Students answer 4 detailed questions regarding the data analysis...
Curated OER
Exploring Online Data Analysis Tools Project Interactivate- Plop It
For this data analysis worksheet, students access an online data analysis tool at the given web site. They collect name length data for classmates and enter it into the tool. The find and manipulate the data to determine how the median...
Curated OER
Statistics - Central Tendency
In this statistics worksheet, students solve and complete 13 different problems that include creating various box-and-whisker plots. First, they write a definition for mean, median, mode and range. Then students explain how to determine...
Curated OER
Measures of Central Tendency
In this measures of central tendency activity, learners solve and complete 6 different problems. First, they count the number of items in each set of data. Then, students determine the mean, median and mode for each. In addition, they...
Curated OER
Central Tendency
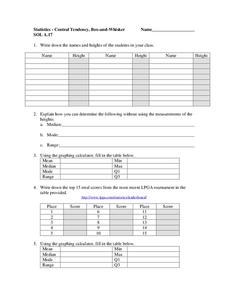
In this central tendency worksheet, students solve and complete 10 different problems that include measures of central tendency. First, they write down the names and heights of students in their class. Then, students explain how they can...
Curated OER
Relations and Functions
In this relations and functions worksheet, 11th graders solve and complete 10 various types of multiple choice problems. First, they use the same relation between two variables as the given table to determine the value of one variable...
Curated OER
Analyzing Data Sets
In this analyzing data sets worksheet, 11th graders solve and complete 35 various types of problems that include the analysis of data given. First, they determine the equation that best describes the data shown in a table. Then, students...
Curated OER
Slopes for the Mathematically Inclined
For this slope worksheet, 9th graders solve and complete 6 different problems that include completing charts and applying applications to the real world. First, they use the pictures shown to measure the riser and tread of 3 consecutive...


