Curated OER
Graphing
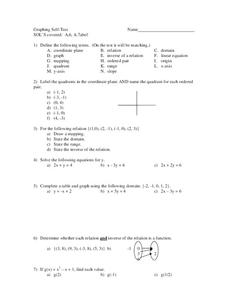
In this graphing worksheet, 9th graders solve and graph 8 different problems that include defining various terms related to graphing. First, they label the quadrants in a coordinate plane and name the quadrant for each listed ordered...
Curated OER
7th Grade Mathematics Booklet
In this 7th grade mathematics compilation worksheet, 7th graders solve and complete 40 various types of mathematics problems. They determine the measure of various angles and the side-lengths in integers of a square. Students also...
Curated OER
Central Tendency
In this central tendency activity, 8th graders solve 10 different problems that include determining the mean, mode, and median of various situations. First, they prepare a frequency distribution with a class interval for the data found...
Curated OER
Mean, Median, Mode, and Range
In this mean, median, mode, and range worksheet, students define and solve 5 detailed questions that include finding the mean, median, mode, and range of numbers. First, they calculate the mean, median, mode, and range for each set of...
Curated OER
Measures of Central Tendency- Mean, Median, and Mode
In this measures of central tendency instructional activity, students read explanations of mean, median, and mode. They complete 6 multiple step questions that require them to find the measures of central tendency for different data...
Curated OER
Data Management and Probability: Applications
In this data management and probability applications activity, 7th graders solve 13 different types of problems that include finding the mean, median, mode, and range of each set of values, as well as, solving a number of word problems....
Curated OER
Data Management and Probability: Applications
In this data management and probability applications worksheet, 8th graders solve 20 various types of probability problems. They find the mean, median, mode and range of various numbers. Then, students use the spinner illustration to...
Curated OER
Parabolic Equations
In this parabolic instructional activity, students write an equation of a parabola which satisfies given conditions. They match equations to the correct graph. Students identify the vertex, domain and range of an equation. This...
Math Mammoth
Stem-and-Leaf Plots 3
For this stem-and-leaf instructional activity, students place statistical data in a stem-and-leaf plot. They identify the median, and range in a given set of data. There are four multi-step problems on this one-page instructional activity.
Math Mammoth
Bar Graphs 1
In this bar graph activity, students organize data in a frequency table, then create a bar graph. They find the average of the data. This one-page activity contains two multi-step problems.
Curated OER
Finding Domain and Range
In this domain and range worksheet, students observe a graph and identify the domain and range of given functions. Afterwards, they solve functions to identify the range. Fifteen problems are provided on this one-page worksheet.
Curated OER
Box and Whisker Plots
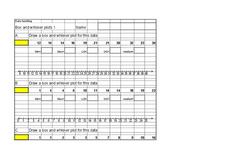
In this math worksheet, learners compute the median of sets of numbers. They create box and whisker plots. Students identify the median, upper and lower quartiles, and minimum/maximum amounts. On the last page of this worksheet, learners...
Curated OER
Find the Average
In this math worksheet, students solve five word problems. In each word problem, students solve the problem by finding the average.
Curated OER
Maths at the Mill; A Mathematical Trail Around Sarehole Mill
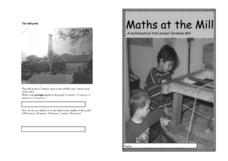
In this math worksheet, students solve math problems based on a trip around the Sarehole Mill. The worksheet includes black and white photographs of the site as well as questions that relate to the mill. Students answer questions about...
Curated OER
Integration: Statistics
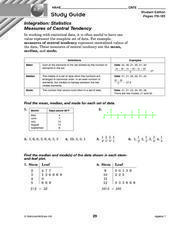
In this math worksheet, students find the mean, median and mode for 6 number sets. Students then find the median and mode for data found in 2 stem-and-leaf plots.
Curated OER
Data Analysis and Probability
Learners make their own puzzle grid that illustrates the number of sit-ups students in a gym class did in one minute, then they make a histogram for this same data. Then they title their graph and label the scales and axes and graph the...
Curated OER
Metric Olympics
Students participate in a Metric Olympics event and use metric measurements to measure actual performances in their events. They throw a plastic straw for a javelin event, participate in a long jump and high jump event, and a variety of...
Curated OER
What Does Average Look Like?
Fifth graders explore the concepts of range, median, mode, and mean through the use of graphs drawn from models. They use manipulatives to represent data they have collected within their groups, and compare the differences between mode,...
Curated OER
Introduction to Measures of Central Tendency and Variability
Students calculate the mean, median, mode, range, and interquartile range for a set of data. They create a box and whisker plot using paper, pencil and technology.
Curated OER
Making Informed Decisions Using Measures of Central Tendency
Students calculate the mean, median, mode, range, and interquartile range for a set of data. They create a box and whisker plot using paper and pencil and technology and determine which measure of central tendency is the most helpful in...
Curated OER
Mean, Median, and Mode
Students find the mean, median, and mode for a set of data. They define terms and find examples, as well as complete practice exercises. They work cooperatively to analyze real data from a variety of websites provided. To...
Curated OER
Exploring Centers of a Triangle: Part 2
Students model and solve a real-world problem by constructing the centroid of a triangle. They explore relationships of the medians of a triangle and investigate how the centroid partitions each of the medians. Students investigate...
Center of Excellence for Science and Mathematics Education
A Sick Astronaut
Aspiring astronauts graph, interpret, and analyze data. They investigate the relationship between two variables in a problem situation. Using both graphic and symbolic representations they will grasp the concept of line of best fit to...
Curated OER
Mean, Median, and Mode
Seventh graders examine the uses of mean, median, and mode. They define key vocabulary terms, observe the teacher model examples of mean, median, and mode, and discuss real world examples of central tendency of sets of data. Students...


