Curated OER
Bar Graphs and Histograms
In this bar graphs and histograms worksheet, students create bar graphs and histograms from given information. They interpret graphs. This one-page worksheet contains 6 multi-step problems.
Curated OER
Classifying Triangles
In this classifying triangles worksheet, 10th graders solve and complete 11 different types of problems. First, they state whether each segment shown is an altitude, median, or neither. Then, students solve for x and find the requested...
Curated OER
Median and Mode
In this median/mode worksheet, students solve 6 problems, using a table of students and their heights in centimeters. Students find median, mode, outliers and arrange data from least to greatest.
Curated OER
Hands On: Model Finding the Mean
For this data worksheet, 5th graders use counters to model finding the mean in 6 word problems. They work with 6 sets of numbers which include fractions.
Curated OER
Mean, Median and Mode
For this mean, median and mode worksheet, students solve 6 problems involving mean, median and mode. Students are given a "hint" for problems 1 and 2.
Curated OER
Dynamic Data Range, Mode, and Median
Students practice statistics skills by calculating range, mode, and median. In this 4th - 6th grade lesson plan, students calculate range, median, and mode of given numbers while playing a game.
Curated OER
Range and Mode
In this data interpretation learning exercise, 2nd graders review the definitions of range and mode. They use the information from a data table to answer 5 questions about the children in after-school clubs.
Curated OER
Triangles
In this triangles worksheet, 10th graders solve and complete 6 different problems. First, they draw a median from a given point and an altitude. Then, students complete each statement using the picture. They also find the line that is...
Curated OER
Data Analysis
In this data analysis activity, students answer 4 questions using a weather report chart. Topics include mean, median, mode and range.
Curated OER
Range and Mode Practice 4.5
In this range and mode worksheet, students study a data table that shows the ages of children in a school play. Students solve 5 problems pertaining to the range and mode of the information.
Curated OER
Range and Mode Reteach 4.5
In this range and mode worksheet, students analyze the data table and graph that show numbers of books read. Students use the data to answer 4 questions.
Curated OER
Mean, Median, Mode, and Range: Reteach
In this line plots worksheet, students review how to make a line plot to show data and review the steps to find mean, median, mode, and range. Students then make a line plot for the data in exercise 1 and use it to answer the remaining...
Curated OER
Triangles
In this triangles worksheet, 10th graders solve and complete 2 different problems. First, they find the perimeter of each triangle as described. Then, students find the slope of each side and altitude to each side of the triangles. In...
Curated OER
Triangle Proofs
In this triangle proofs worksheet, students answer 5 questions about triangles and polygons given certain information. Students then construct 4 triangle or polygon proofs.
Curated OER
Equation of a Line
In this equation of a line worksheet, 9th graders solve and complete 7 different problems. First, they find all values of the constant k, if the line contains the given points. Then, students write an equation of the line which passes...
Curated OER
Standard Deviation
In this standard deviation worksheet, students solve and complete 10 different types of problems. First, they determine the number of standard deviations an item was from its mean. Then, students draw a model of what this would look...
Curated OER
Properties of Geometry
In this properties of geometry worksheet, 10th graders solve and complete 12 different problems that include various theorems. First, they draw a figure that illustrates the SAS inequality property. Then, students prove that two line...
Curated OER
Topic 2.1 - Relations and Functions
In this function worksheet, students state the domain and range of 2 functions. They then determine whether 7 relations are functions or not. Finally, students solve 6 problems in which they find the value of a specific function.
Curated OER
Data Analysis Self-Test
For this data analysis worksheet, learners complete 1 problem that has 7 parts involving mean, median, mode, range, and quartiles. Students then perform 5 operations with matrices.
Curated OER
Inverse Functions 8-8
In this inverse function worksheet, students find the inverse function of given values. This two-page worksheet contains 12 multi-step problems.
Curated OER
Quiz: What's Before, Between and After?
In this what's before, between and after worksheet, students identify the missing number in a sequence. All numbers contain one or two digits and are in a sequence of one. This one-page worksheet contains ten problems.
Curated OER
Scatterplots
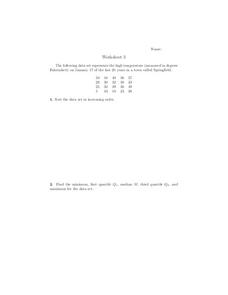
In this scatterplots worksheet, 9th graders solve and complete 6 different word problems with different sets of data. First, they sort the data set in increasing order and find the minimum, first quartile, median, third quartile, and...
Curated OER
Relations and Functions
For this relations and functions worksheet, students answer 5 multiple choice questions that involve finding domain and range and function notation.
Curated OER
Statistics
In this statistics worksheet, 7th graders solve and complete 5 different problems related to determining various statistics. First, they find the average of a given set of numbers. Then, students find the median and mode of each set of...


