Curated OER
Math: Reaching New Heights
Students apply math skills to assess the range, mean, mode, and median of data sets. Using a "Reaching New Heights" worksheet, they review and discuss how to calculate the answers. Students write complete explanations of all their...
Curated OER
Using Averages to Create Graphs Through Excel
Sixth graders create and use a spreadsheet to make graphs which will be used to analyze Progress Report and Final Report Card grades. They practice finding the mean, median, mode, and range of a data set. Students also incorporate column...
Curated OER
Flavorful Spreadsheets
Learners create a spreadsheet which includes a bar graph. They sort and classify information and use the average function on a spreadsheet. They research Skittles candy and summarize their findings on a spreadsheet.
Curated OER
What Happens on Average
Fifth graders are introduced to convergence of sequences based on averaging previous terms in the sequence. The power of the "fill-down" function in spreadsheets is exploited. By using various starting numbers, and inferring the limit,...
Curated OER
Bones and Math
students identify and explore the connection between math and the bones of the human body. Students collect data about bones from their classmates and from adults, apply formulas that relate this data to a person's height, and organize...
Curated OER
Not Your Average Average
Learners discover that if a distance is traveled in two or more segments at different average speeds, you cannot average the average speeds. Instead the total distance traveled must be divided by the total elapsed time. Students practice...
Curated OER
Shooting Stats
Eighth graders discover the important role statistics play in sports and that appropriate data must be collected to do a statistical analysis. Students practice calculating statistics by charting a professional player of their choice.
Curated OER
Finding Averages
Students have problems in the lesson where they need to find the average of a set of numbers. As a class, they work a few problems and then independently complete a worksheet practicing their new skill.
Curated OER
A RealSim Surface Look at Descriptive Statistics
Students explore the concepts of mean and variance. They observe properties of materials to their basic atomic or molecular structure. Students use spreadsheet software to record, tabulate and analyze collected information.
Curated OER
Basketball Caps
Learners work on a problem, individually or in pairs. They are asked questions that focus on average. They discus that the average number represents an equal redistribution , rather than just being able to state the rule. They write...
Curated OER
Using Computers for Statistical Analysis of Weather
Students use temperature, cloud cover and other weather data from the S'COOL website to statistically analyze weather around the country. They use computers to calculate and graph standard deviations, means and modes of the weather...
Curated OER
Thumb Measurement
Pupils practice measuring using the metric system and millimeters. They measure their thumbs and record their findings. Students record the findings of their classmates and find the average or mean for the two groups.
Curated OER
"Checking In"
Students examine the checkpoints along the Iditarod Trail. They calculate the distances, mean and medians between each checkpoint. Using the internet, they follow along a virtual trail. They answer questions about when it would be more...
Curated OER
Math Can Be Mean!
Fifth graders are introduced to the topic of means. Calculating the mean, mode and median, they describe what each set of numbers tell and do not tell about the data. They use a line graph to practice finding the mean. They also use...
Curated OER
Charting the Heights
Learners enter data regarding the height of classmates into a spreadsheet. Formulas will also be entered to find the median, mean, and mode of the data.
Curated OER
Growing Up With A Mission
Student measure heights and graph them using growth charts for which they find the mean, mode, and median of the data set. They graph points on a Cartesian coordinate system.
Curated OER
Figuring Baseball Averages
Fifth graders examine baseball cards and discuss the information that is found on them. They use the internet to calculate averages of three players. They discuss how to correctly calculate the average.
Curated OER
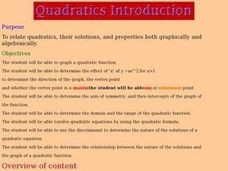
Quadratics Introduction
Young scholars investigate quadratic functions graphically and algebraically.
Curated OER
Watermelon Math
Learners compute the mean and median of the number of seeds in a watermelon. They work in groups with a slice of water to complete and compare their calculations. They get a class average and mean.
Curated OER
Cruise Conditions Graphing & Statistics
Students monitor weather conditions for an eighteen day period at a specific location. The temperature of both air and water is taken and the mean, median, and mode calculated. Differences between the highest and lowest recordings are made.
Curated OER
Home, Home in the City
Young scholars create a spreadsheet that organizes housing information in the Houston area. They write a formula to determine the average price of homes in the Houston area.
Curated OER
Data Days
Sixth graders practice collecting, organizing and displaying data. They create circle, bar, line and picto graphs. They analyze data in small and large sample groups.
Curated OER
Math: How Many Ways Can You Find the Middle?
Twelfth graders find the mean, median, and modes of stacks of Lego blocks, They search in newspapers for real life applications of them. They present oral reports on what they have learned.
Curated OER
Prairie Dogs: Finding the Balance
Students study about prairie dogs and determine the mean, median, and mode of a prairie dog tow's population.


