Math Mammoth
Mean, Median, and Mode One
In this mean, median, and mode learning exercise, students find the mean, median, and mode for different problems of money, weight, and more. Students complete 6 problems.
Curated OER
Global Statistics
Students determine statistics based on data. In this statistics lesson, students use data and record in charts. Students create graphs based on the statistics found.
Curated OER
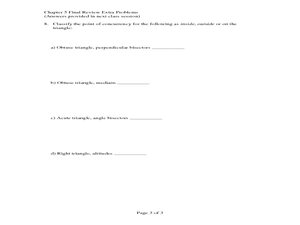
Chapter 5 Final Review Extra Problems. Triangles
In this triangles worksheet, students identify the median, altitude, segment, angle bisector, perpendicular bisector and triangle midsegment of triangles. They find the perimeter of triangles. This three-page worksheet contains 8...
Curated OER
Math Regents Exam Questions: Lesson 1-6 - Mean, Median, Mode and Range
In this mean and median worksheet, students examine given data and determine the measures of central tendency for the data. Students compute the mode, mean, median, and range of data. They create stem-and-leaf plots. This ten-page...
Curated OER
Regents Exam Questions: Domain and Range 1
For this domain and range worksheet, students examine functions and identify the range of a function. They find the maximum and minimum value of a function. This two-page worksheet contains 7 multiple-choice problems. Answers are...
Curated OER
Fifty Members of a Group: Average
In this average activity, high schoolers solve 1 word problem. Students find the average age of 47 people given the average of 50 people and three people's ages who leave the group.
Curated OER
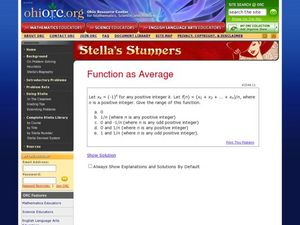
Function as Average
In this secondary mathematics worksheet, high schoolers determine the range of the average written as a function. The one page worksheet contains one problem with the solution.
Curated OER
The Test Problem
For this word problem worksheet, students solve 1 word problem in short answer format. Students determine an unknown grade on a test given a formula, a few quiz grades, and a final grade by using averages.
Curated OER
Triangle Island
Young scholars calculate the altitude of triangles. In the web based lesson, students explore the interior distance from a given point in a polygon to its side. They compute the sum of these lengths. Young scholars read life...
Curated OER
Operations on Functions
In this operations and functions instructional activity, students add, subtract, multiply, and divide functions. This one-page instructional activity contains 18 multi-step problems.
Curated OER
Take a Walk
Sixth graders graph acceleration and practice using the metric system. In this physics lesson, 6th graders take turns timing each other as they walk 15 meters. Students then chart and graph their data using the metric system.
Curated OER
Mean, Median, Mode and Range
Fourth graders investigate when to find the mean, median, mode and range. In this statistical concepts lesson, 4th graders collect data, make observations and graph the data. Students verify their work on the computer.
Curated OER
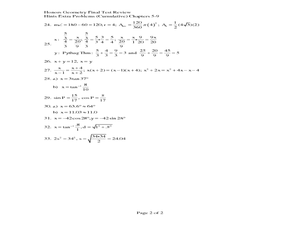
Geometric Concepts and Polygons
In this geometry worksheet, students identify the altitude, perpendicular bisector, median, angle bisector and the area of different polygons. There are 33 problems.
Curated OER
Unit 8 - Statistical Diagrams
For this statistical diagrams worksheet, high schoolers solve 30 short answer problems. Students find the mean of a set of numbers and read/interpret a graph to answer questions. High schoolers determine the x-values that satisfy a...
Curated OER
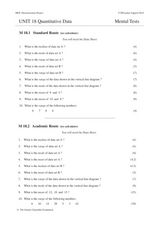
Unit 18 Quantitative Data
In this central tendency worksheet, students answer 30 short answer questions about data sets. Students find the median, mean, mode, and range of data sets.
Curated OER
The Mean, the Median, and the Mode
For this statistics and probability worksheet, students analyze data to determine the mean, median, or mode as indicated for the given set of data. The four page worksheet contains a combination of twenty-five multiple choice and free...
Curated OER
Measures of Central Tendency
For this Algebra I worksheet, 9th graders determine the measures of central tendency for a given data set. The one page worksheet contains four problems. Answers are provided.
Curated OER
Quartiles, Percentiles, and Cumulative Frequency
In this statistics lesson, 11th graders are asked to calculate the percentiles, quartiles and cumulative frequency given different graphs and data. There are 6 questions with an answer key.
Curated OER
Find the Mean #1
For this numbers worksheet, students study 8 sets of numbers and determine the mean for each set. Students write their answers in the boxes provided.
Curated OER
Find the Mean #1
In this numbers worksheet, students study 8 sets of whole numbers and determine the mean for each set. Students write their answers in the boxes provided.
Curated OER
Find the Range #5
In this mathematics worksheet, students view 6 different sets of numbers. Students, for each set of numbers, find the mean, mode, median and range. Students place their answers in the boxes provided.
Curated OER
Find the Mean, Median, Mode & Range
In this numbers worksheet, learners study 6 different sets of numbers. Students, for each set of numbers, find the mean, median, mode and range. Learners put their answers in the boxes provided.
Curated OER
Find the Mode Worksheet #4
In this finding the mode worksheet, 5th graders find the mode of 6 sets of numbers. They write the mode of each set in the box below the numbers.
Curated OER
Find the Range #2
In this finding the range worksheet, students find the mean, median, mode, and range of each of six number sets. They write the answers in the boxes next to each label.


