Curated OER
Counting Coins
Second graders identify a quarter, dime, penny, nickel, and dime. They match the coin with it's monetary value, collect data on excel spreadsheet, and create a graph in Excel. Students participate in group activities.
Saline Area Schools
Moving Home: A Map Skills Project
You have just been informed you are moving, but you have the choice of three locations. Where do you go? This is the question class members answer in a map skills project. Learners examine three locations using maps, gather...
National Security Agency
Line Graphs: Gone Graphing
Practice graphing and interpreting data on line graphs with 36 pages of math activities. With rationale, worksheets, and assessment suggestions, the resource is a great addition to any graphing unit.
Curated OER
What Came From Where?
Students research patterns and networks of economic interdependence. They work cooperatively to create 3-dimensional representations of common objects and charts describing the objects' components and countries of origin. Students...
Curated OER
Maps and Modes, Finding a Mean Home on the Range
Fifth graders investigate data from maps to solve problems. In this data lesson, 5th graders study maps and collect data from each map. Students present their data in a variety of ways and calculate the mode, mean, median, and range.
Curated OER
Solving Multi-Step Problems
Use this multi-step problems worksheet to have your charges complete multi-step problems including money, fractions, charts, and more. They complete 30 problems total.
Curated OER
Problem Solving and Puzzles: 3
Your class can use this to warm up or to discuss their problem solving strategies. They review the 8's times tables, relate the multiplication problems to division, then use a chart to solve a word problem involving money.
Curated OER
Color Mixing
Students experiment with primary colored water to mix new colors. They record new colors on a simple data sheet and share opinions on their work.
Curated OER
Counting
First graders explore collecting data. They collect data using a data collection sheet and enter the data into Excel. Students create graphs using Excel. They share their graphs with the class.
Curated OER
This is My Neighborhood
Students predict the things that they may see, smell, or hear in their neighborhood. They take part in a neighborhood walk, creating a rough map of their neighborhood as they go. Upon return to the classroom, students create a final map...
Curated OER
Logs, Charts, and Journals: What's On Your Plate?
Have your writers identify and use words that appeal to the senses. They create a chart of sensory words and record some of their favorites, then write a journal entry in which they describe eating at a restaurant using sensory details....
Curated OER
Pronouns and Nouns
Second graders identify nouns and pronouns from a story. In this nouns and pronouns instructional activity, 2nd graders review the definition of these words. Students then locate nouns and pronouns in the book they are reading. Students...
Curated OER
Navajo Weaving
Young scholars explore the Navajo culture. In this Navajo Indians lesson, students gain information about their weaving and dancing. Young scholars note the patterns in the weaving. Students create a dance that corresponds with the...
Curated OER
Earth Energy Budget Pre Lab
Students explore energy by conducting an in class experiment. In this climate change lesson, students conduct a water vapor experiment in a soda bottle. Students utilize graphs and charts to analyze the results of the experiment and help...
Curated OER
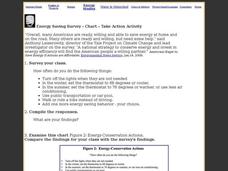
Energy Saving Survey - Chart - Take Action Activity
In this saving energy instructional activity, students survey the class about saving energy, examine an energy chart, and answer short answer questions. Students complete 4 tasks.
Curated OER
Swimmy's Friends
Students solve problems using various strategies. In this problem solving lesson, students read the book Swimmy by Leo Lionni. Students make fish swimming patterns, measure how many goldfish crackers it takes to make a handprint and...
Raytheon
Data Analysis and Interpretation
For this data analysis and interpretation worksheet, learners use charts, graphs, statistics to solve 42 pages of problems with answer key included.
Curated OER
Percents Practice
In this decimals worksheet, students complete problems involving decimals, percents, fractions, word problems, and charts. Students complete 72 problems total.
Curated OER
The Great Pollinators
Students discover the reproductive parts of a plant. In this biology lesson, students identify and categorize several different plants they dissect in class. Students record their information using a data chart.
Curated OER
Bird and Breakfast
Students examine winter birds. In this KWL chart lesson, students fill out the chart and view a PowerPoint presentation. Students then complete the chart and discuss winter birds.
Curated OER
Data Handling
In this data handling activity, students interpret data found in table, graphs and charts. They organize data and draw bar charts. This two-page activity contains 2 multi-step problems.
Curated OER
Then and Now
Students conduct research and use census data to compare different times and places. In this census lesson, students interpret data from charts and graphs, comparing census information from two time periods as well as from two different...
Curated OER
Sunshine Math-1
In this math skills activity, students answer 7 questions in which they use various basic math skills. They use number lines, charts, number blocks, a calendar and a ruler to complete this activity.
Curated OER
Responding to A Sound of Thunder by Writing PowerPoint Presentations
Students, after reading "A Sound of Thunder," create a PowerPoint presentation about time travel. They study and utilize a graphic organizer to assist them in preparing to deliver an oral presentation next and finally they print their...


