Curated OER
Graphs! Graphs! Graphs!
Students practice making charts and graphs from data on spreadsheets. Individually, they create a graph representing the latest information on voter registration. They answer questions and analyze the data to end the lesson.
Curated OER
Thanksgiving Feast (Read the Charts)
Pupils practice reading charts about foods country of origin. They interpret information and answer questions related to charts. They discover how food production adds to the economy.
Curated OER
A Data Processing Lesson for Statistics -- Reading a Table or Chart
Students identify the structure and key parts of tables and charts. They determine which data is meanjngful and make comparisons with the data. They describe the scope of the AIDS plague throughout the world.
Curated OER
What's the Weather?
Second graders make daily weather observations, record them with appropriate stickers on a chart, and then summarize them at the end of the week in the form of a bar graph.
Curated OER
Weather Graphing
Every morning students complete the weather chart. They use colors to reflect the cloud cover and symbols for rain, snow, etc.
Curated OER
My Favorite Birthday
Students collect and organize data from classmates, display data on simple chart, and plan class birthday party.
Curated OER
What Are We Listening To?
Students gather data from a web site on number of music albums sold by genre for the last two years. They convert these figures to fractions, decimals, and percents, and display the results in bar graphs and pie charts.
Curated OER
Investigating: Interpreting Graphs and Analyzing Data
Students explore statistics by researching class birthday data. In this data analysis lesson, students investigate the different birthdays among their classmates and create data tables based on the given information. Students view bar...
Curated OER
Getting Graphs: Researching Genealogy-A Piece of Pie
Third graders research their genealogy. In this math lesson, 3rd graders collect data and create graphs and charts. A presentation of their findings is given.
Curated OER
Math Made Easy
Students evaluate word problems. In this problem solving lesson, students are presented with word problems requiring graphing skills and students work independently to solve.
Curated OER
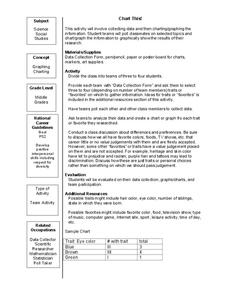
Chart This!
Students collect data and graph or chart the information. In this data organization instructional activity, students poll their classmates about certain topics and chart or graph the information to show the results of their research.
Curated OER
Santa's List Sums
In this Christmas math worksheet, students help Santa find the number of children on each street by adding the sum of boys and girls listed in the chart. Students solve 17 problems.
Curated OER
Santa's List Sums (12)
In this Christmas math worksheet, students help Santa find the number of children on the 17 streets by adding the number of boys and girls in each line of the chart.
Curated OER
Math Review
In this math review activity, students complete 40 assorted problems pertaining to counting money (in English pence), addition and subtraction, divisibility, and milometer (odometer) word problems.
Curated OER
Data Chart
In this graphic organizer worksheet, students use this blank data chart for any math or language arts purpose. There are 2 vertical columns on the chart with spaces for headings at the top.
Curated OER
Fruit Shopping
In this fruit shopping worksheet, students are given pictures of various fruits to put in the shopping bags. Students read and interpret the given chart to know the correct amount of each fruit.
Curated OER
What's Your Favorite Planet?
Fourth graders interpret a graph and make correlations using data. After taking a class survey, 4th graders create a class graph of their favorite planets. Working in small groups, they interpret the information and create at least ten...
Curated OER
Unit 2: Lesson 7
Students are introduced to spreadsheets. They conduct a survey of television viewing time of different shows based on different age categories. Students work in small groups. They collect, data and interpret the data from a survey.
Curated OER
Statistics and Graphing with Accelerated Math
Students create charts and graphs, using a spreadsheet program, of their results from their accelerated math lessons. Students discover how graphs can be used to interpret data in our everyday lives as well as how several different...
Curated OER
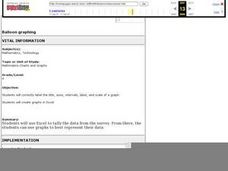
Balloon Graphing
Fourth graders explore data, charts and graphs. They create graphs using titles, labels, axes, intervals, and scale correctly. Students enter their data into Excel and create a graph.
University of Texas
Inside Mathematics: Parking Cars [Pdf]
This task challenges a student to use their understanding of scale to read and interpret data in a bar graph.
Other
Bucks County Community College: Visual Organizers
This site walks you through the benefits of visual organizers, and focuses on a variety of types: tables, charts, graphs, timelines, flowcharts, diagrams, and webs.
Virtual Salt
Virtual Salt: Ideas for Enhancing Oral Reports
A helpful review of important parts of your report and ways to strengthen it. SL.9-10.4 Presentation
Texas Education Agency
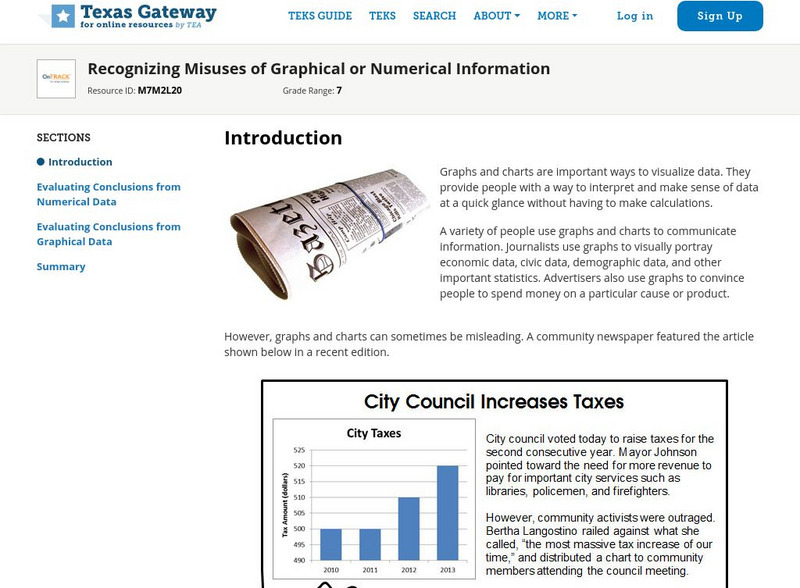
Texas Gateway: Recognizing Misuses of Graphical or Numerical Information
Given a problem situation, the student will analyze data presented in graphical or tabular form by evaluating the predictions and conclusions based on the information given.


![Inside Mathematics: Parking Cars [Pdf] Lesson Plan Inside Mathematics: Parking Cars [Pdf] Lesson Plan](https://d15y2dacu3jp90.cloudfront.net/images/attachment_defaults/resource/large/FPO-knovation.png)

