Capital Community College Foundation
Guide to Grammar and Writing: Sequence of Verb Tenses
This grammar page teaches the sequence of verbs, including simple present and past, present and past perfect, future, future perfect, and infinitive verbs. Includes chart and examples. L.11-12.4b Patterns/changes
Texas Education Agency
Texas Gateway: Evaluate Graphics in Informational/procedural Text
You will learn how to evaluate graphics for their clarity in communicating meaning and achieving a specific purpose.
PBS
Pbs Learning Media: Garden Spiders
In this video segment from Garden Insects, learn about six varieties of spiders that live in one garden. [2:40]
PBS
Pbs Kids Afterschool Adventure!: Operation: All About Us Activity Plan
It's time to stand in the spotlight! During this Afterschool Adventure, children will learn about and practice a variety of math skills as they gather information about their favorite subject-themselves! Children will start out by...
Grammarly
Grammarly Handbook: Visuals: Graphs, Charts, and Diagrams
This article explains that graphs, charts, and diagrams are used to display information visually. The choice of what type of graph or chart to use depends on the information to be displayed. Software programs make these much easier to...
PBS
Pbs Mathline Lesson Plan: Struts'n Stuff [Pdf]
Incorporating concepts in algebra, number sense, patterning, data collection, and geometry, this lesson engages students in various hands-on activities to explore the relationship between regular polygons and the number of diagonals...
Quia
Quia: Reading Charts and Graphs Quiz
This 25-question quiz asks students to read various kinds of charts and graphs and to select the correct answers to the questions. Immediate feedback is provided after each question. Java is required.
The Franklin Institute
Frankin Institute Online: Group Graphing
This site from The Franklin Institute explores how to make a simple graph using a spreadsheet to portray survey data. It also gives a set of interesting sports-related web sites so that students can get statistical inforamtion.
Read Works
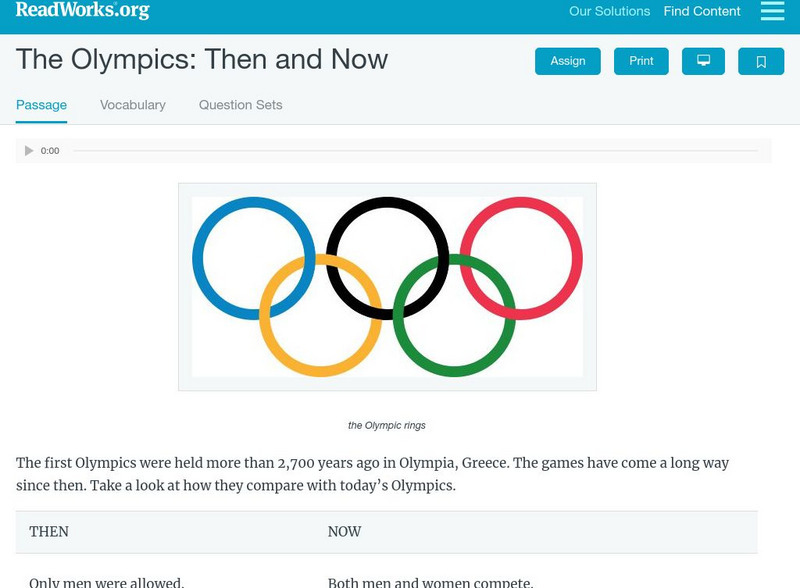
Read Works: The Olympics Then and Now
[Free Registration/Login Required] Students read two charts with information about the Olympics in ancient Greece and in modern times. A question sheet is available to help students build skills in comparing and contrasting.
Illustrative Mathematics
Illustrative Mathematics: Color Week
Five-year-olds need to count things that relate to them. This activity builds on their need to be included or see the relevance of their counting. Students will practice counting, writing numbers, and filling in a chart or bar graph....
BBC
Bbc Skillswise: Graphs: Lists and Tables
Resource shows how to use lists and tables to organize information.
Science Buddies
Science Buddies: Scientific Method Data Analysis/graphs
At the end of your experiment you should review all of the data you have collected. See samples of data analysis charts and graphs. Find out what makes for a good chart or graph using the self-grading rubrics.
Science Education Resource Center at Carleton College
Serc: Rainfall and Elevation: A Charting and Critical Thinking Exercise
In this lab, students will learn to organize and present data in a visual way so that they can then summarize in writing their conclusions about the relationships between the data.
Discovery Education
Discovery Education: Science Fair Central: Investigation Set Up and Collect Data
A brief overview of how to gather both quantitative and qualitative data, complete with a sample data table.
PBS
Pbs Learning Media: Everyday Algebra Plus: Targeted Math Instruction
Algebra lesson focuses on using patterns and relationships to write equations with two variables to represent relationships and patterns in real-world problems, plotting ordered pairs on a coordinate grid, and interpreting the meaning of...
Library of Congress
Loc: Teachers: The Grapes of Wrath
A Library of Congress lesson on "The Grapes of Wrath," through which students discover how cultural artifacts from the book support its themes and see connections "between the social, cultural, and literary contexts of literature."
Other
The Topic: Charts and Graphs
Brief descriptions of charts and graphs, followed by links to larger sites on the same subject.
Other
Interactive 100 Square Hundreds Chart
Practice or assess number sense with this interactive hundreds charts. Start at zero or one and apply different colors to show patterns and number relationships. Excellent for whole group instruction using a video monitor or for...
EL Education
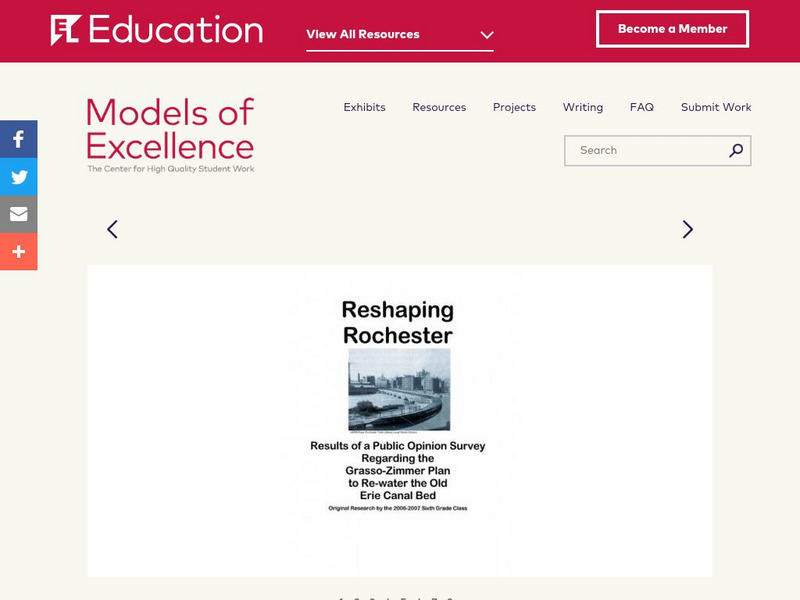
El Education: Reshaping Rochester
After learning about the effects of re-watering a dry water way in their city, students realize that public support would be needed for such an undertaking. In order to determine public support, students design and implement a survey,...
ClassFlow
Class Flow: All About Whales
[Free Registration/Login Required] The objective of this lesson about whales is to learn about the differences between mammals and fish using the Venn diagram. The lesson also covers charting animal sizes and ends with a 10-question...
ClassFlow
Class Flow: August Calendar
[Free Registration/Login Required] Various charts for daily routines (seasons, days of the week, national anthem, etc.)
ClassFlow
Class Flow: Cumulative Frequency Data Handling
[Free Registration/Login Required] Students draw conclusions and engage in tables and charts involving cumulative frequency; a wonderful review of student's knowledge.
ClassFlow
Class Flow: July Calendar
[Free Registration/Login Required] Daily warm-up activity/routine charts (Pledge of Allegiance, National Anthem, days of the week, money, etc.) for the month of July.


