Virginia Department of Education
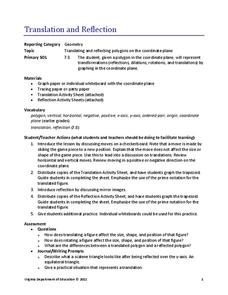
Translation and Reflection
Bring about the change you want to see in the world or at least in your lesson plans. Young mathematicians learn about translation and reflections by applying them to polygons on the coordinate plane. Results provide data to...
Virginia Department of Education
Dilation
Open up your pupils' eyes and minds on dilations. Scholars perform dilations on a trapezoid on the coordinate plane. They compare the image to the preimage and develop generalizations about dilations.
Virginia Department of Education
Rotation
Rotate this resource into your lesson plans. Scholars rotate polygons in the coordinate plane by multiples of 90 degrees. They then compare the original and new figures to develop conjectures about coordinate points after rotations.
School Mathematics Project
Resource Sheets
This extensive and far-reaching collection of worksheets puts a new twist on many basic concepts. Learners use multiplication to trace a path from one point to another, tile a plane by converting between improper and proper fractions,...
Google
Midpoint and Distance Foldable
Support young mathematicians with learning the concepts of midpoint and distance with this foldable resource. Offering both graphic examples and written equations, this reference clearly demonstrates for students how these...
Curated OER
An Introduction to the Coordinate Plane
In this geometry learning exercise, students plot points on a coordinate plane and identify the different quadrants each point is in. They have to be able to identify coordinate pairs, given the points on the graph. There are 62...
Curated OER
Math Mediator Lesson 10: Slope
Students explore the concept of slope. In this Algebra I lesson, students investigate the definition of slope as rise over run or change in y compared to change in x. The lesson includes a real-world problem in which the...
Curated OER
Data
Students collect data from an experiment they perform. For this data lesson, students use multiple representations to solve practical problems; describe advantages and disadvantages of the use of each representation. Then, they evaluate...
Curated OER
Graphing Greenery
Students gather leaves and trace them on graph paper. They plot coordinates that approximate the shape of the leaves and share those coordinates as "worksheets" for other students to complete.
Curated OER
Perplexing Puzzles
Elementary and middle schoolers explore scatter plots. In this graphing instructional activity, pupils work in small groups and use jigsaw puzzles to develop a scatter plot. Younger students may develop a bar graph.
Curated OER
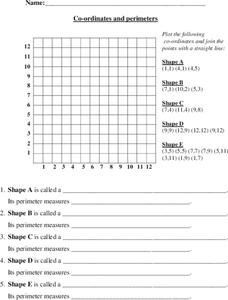
Coordinates and Perimeters
Here is a lesson containing a great activity based on coordinates, and the perimeters of shapes created using a given set of coordinates. After youngsters creat a shape on a grid based on some coordinate pairs, they must identify which...
Curated OER
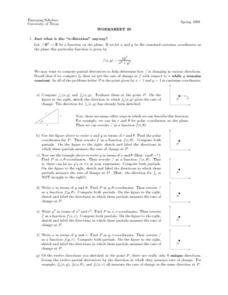
Worksheet 20 - Derivatives
In this derivative worksheet, students solve functions, sketch the direction of the rate of change, and describe functions using polar coordinates. This two-page worksheet contains seven multi-step problems.
Curated OER
The Unit Circle
In this unit circle worksheet, students measure angles in circles and label each point in the amount of degrees, or radian measurement. They measure and label 36 angles located in three circles.
Curated OER
Addition of Ordinates
In this college algebra worksheet, students view graphs of two functions. They are given a values chart. Students graph the result of adding the two functions.
Curated OER
What's Your Shoe Size? Linear Regression with MS Excel
Learners collect and analyze data. In this statistics activity, pupils create a liner model of their data and analyze it using central tendencies. They find the linear regression using a spreadsheet.
Curated OER
Measuring Segments
Middle and high schoolers solve 14 problems that include finding the distance between two points in different situations. First, they refer to a number line to find the measure of each point on the line. Then, pupils refer to the...
Curated OER
Applying the Pythagorean Theorem
Learners use the Pythagorean Theorem to find the distances between two points. Use this Pythagorean Theorem lesson plan to have learners find the distances on a coordinate plane in small groups.
Curated OER
Six Exercise Sets on Transformations
Middle and high schoolers solve fifteen problems from six exercise sets covering transformations, reflections, rotations, and enlargements. The solutions are provided.
Curated OER
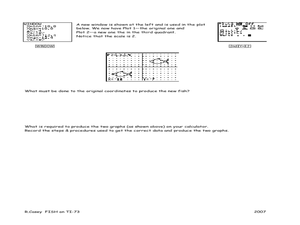
Fishing for Points
Learners explore the concept of ordered pairs. In this ordered pairs lesson, pupils list the ordered pairs of a graph in the shape of a fish. They use their calculator to translate the fish using lists, then translate the fish left,...
Curated OER
Chapter 4 Test: Functions and Integers
In this functions and integers activity, students combine positive and negative integers through addition, subtraction, multiplication and division. They complete function tables and graph the results of linear equations. This six-page...
Curated OER
Domain and Range
In this domain and range worksheet, students write the definitions for relation, function, domain and range. They then find the domain and range of 7 sets of ordered pairs. Finally, students answer 4 questions regarding inverse relations...
Curated OER
Linear Functions: Slope, Graphs, and Models
This math packet provides an opportunity for learners to graph two linear equations on a coordinate grid and determine the slope and y-intercept of each. They use the equation of five lines to find the slope and y-intercepts, and then...
Curated OER
Coordinate Plane Worksheets - Area of Rectangle
In this online math worksheet, students calculate the area of a variety of rectangles given the measure of their vertices. This excellent resource allows the students to check their answers, and to get "hints" should they run into...
Curated OER
Lengths of Horizontal and Vertical Line Segments
Use this lengths of horizontal and vertical line segments practice worksheet to have learners sharpen their problem solving skills as they solve six story problems.


