Curated OER
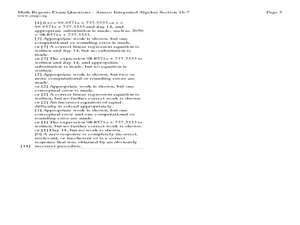
Fourteen Math Regent Exam Statistics Questions on Scatter Plots and Linear Regression
For this linear regression worksheet, students solve fourteen Math Regent Exam questions regarding scatter plots and linear regression. The solutions are provided.
Curated OER
Scatterplots
In this statistics worksheet, students create a scatter plot based on their analysis of data provided form the space shuttle Challenger disaster. The five page worksheet contains four questions. Answers are not provided.
Curated OER
Practice Problems: Correlation and Linear Regression
For this correlation and linear regression worksheet, learners examine data to determine the statistic mean. They compute the percent of the variability. This three-page worksheet contains 16 problems. Answers provided.
Curated OER
Thirst Dilemma (Drinking in the Desert)
Ninth graders explore linear functions. In this Algebra I lesson, 9th graders collect and analyze date as they investigate the question of how long will water last if you are trapped in a desert. Students create scatterplots of their...
Curated OER
Population Dilemma
Ninth graders explore population growth. In this Algebra I activity, 9th graders conduct an experiment simulating population growth. Students create a model and relate the results to a real-world situation. Students create a scatter...
Curated OER
Checking Test Comparability/Scattergrams
Students construct a scattergram graph. In this statistics lesson, students graph data by hand and using a spreadsheet program. They establish lines of best fit and draw conclusions using their graphs.
Curated OER
Line of Best Fit
Students explore the concept of linear regression. In this linear regression lesson, students do a Barbie bungee activity where they collect linear data. Students plot their data using a scatter plot. Students determine a line of best...
Curated OER
Lines of Best Fit
Students explore the concept of line of best fit. In this line of best fit instructional activity, students find lines of best fit in examples about riding your bike home from school and dentistry. Students find two data points and find...
Curated OER
Scatter Plots
In this scatter plots worksheet, students solve and complete 4 different problems. First, they use the table shown to model the relation with a scatter plot and trend line and to predict the value of a variable when given the other...
Curated OER
Equation of a Line
In this equation of a line worksheet, 9th graders solve and complete 4 different multiple choice problems. First, they use the median fit method to determine the equation that most likely represents the line of best fit for the data...
Curated OER
Data Analysis
In this data analysis worksheet, 8th graders solve and complete 4 different problems that include determining the line of best fit for each. First, they write the prediction for an equation for each situation described. Then, students...
Curated OER
Scatterplots
In this scatterplots activity, 9th graders solve 18 different types of problems related to scatterplots. First, they represent a two numerical variable on a scatterplot and describe how the data points are distributed. Then, students...
Curated OER
Linear Regression on TI-83
In this linear regression worksheet, learners use TI-83 calculators to graph linear regressions. Instructions for using the calculator are provided. This two-page worksheet contains six problems.
Curated OER
Linear Regression on TI-89
In this linear regression worksheet, students use the TI-89 calculator to graph linear regressions. Details instructions on the use of the calculator are provided. This one-page worksheet contains six problems.
Curated OER
Linear Regression on TI-86
In this linear regression worksheet, students solve linear regression problems using the TI-86 calculator. Detailed instructions on how to use the calculator are provided. This one-page worksheet contains seven problems.
Curated OER
Linear Regression on TI-85
In this linear regression worksheet, students use TI-85 calculators to complete linear regression expressions. Detailed instructions on the use of the calculator are provided. This one-page worksheet contains seven problems.
Curated OER
Linear Systems: Least Squares Approximations
In this least squares approximation worksheet, students determine the number of solutions a given linear system has. They find the least square error and the equation of a line of best fit for a set of three points. Students find the...
Curated OER
Integration: Statistics, Scatter Plots and Best-Fit Lines
In this math worksheet, learners identify the type (if any) of correlation on 6 scatter plots. They use information given on a table to create a scatter plot and identify the type of correlation. Students use the scatter plot to make...
Curated OER
Lines of Best Fit
Learners determine if there is an associationm in a scatter plot of data. They analyze data through predictios, comparisons, and applications. Students calculate the line of best fit using a graphing calculator. They display data in...
Curated OER
Get a Half Life!
Eighth graders use M&M's to experiment with data. They use a graphing calculator to determine the best equation for their data; linear, quadratic or exponential. They analyze the data to find the half-life of their M&M's.
Curated OER
Line Best Fit
Young scholars identify the line of best fit. For this statistics lesson, students analyze graphs and plots to identify positive, negative or no correlation. They find the line of best fit for different scatter plots.
Curated OER
The Graduation Dilemma
Ninth graders explore data analysis. In this Algebra I lesson, 9th graders collect and organize data to create a scatter plot. Students use the regression feature of the calculator to find the line of best fit and use the equation to...
Curated OER
Unit 13: Graphs, Correlation, Line of Best Fit
Students explore the concepts of graphs, correlations, line of best fit, and the dipstick problem. In this graph, correlation, line of best fit and dipstick problem lesson, students solve problems on the above mentioned topics. ...
Curated OER
Algebra I: Scatter Plots
In this scatter plot instructional activity, students write an equation for a line that would fit the given scatter plot. They create scatter plots from given information. This two-page instructional activity contains eight problems.


