NC State University
Nc State University: Multiple Regression
Excellent, comprehensive site on multiple regression. Key terms are defined and explained as needed. Links to relevant topics are provided.
Wolfram Research
Wolfram Math World: Correlation Coefficient
This is an elaborate site pertaining to the Correlation coefficient. The site begins with a brief introduction to what the correlation coefficient represents then goes into detail on how to find this value. The site has many links and...
Other
Fagler College/nas 111/scientific Methodology
Power Point presentation on scientific method for NAS 102 Human and Environmental Biology II.
Wolfram Research
Wolfram Math World: Correlation Coefficient
MathWorld offers a technical, yet informative, explanation of the correlation coefficient for bivariate normal distribution.
Texas Instruments
Texas Instruments: Exploring Bivariate Data
Students graph scatter plots and understand the concepts of correlation and least-squares regression. They also perform transformations to achieve linearity in the data plot.
Oswego City School District
Regents Exam Prep Center: Multiple Choice Practice: Working With Data
Test your knowledge of working with data by taking this twenty question multiple-choice practice test. Use a graphing calculator to help with any graphing problems and check your answers at any given time throughout the test.
Texas Instruments
Texas Instruments: Boat Registration and Manatee Deaths in Florida
Students will explore the data on boat registrations and manatee deaths in Florida. They will use the data, the graph of the data and the line of best fit to make predictions about the relationship of the data.
Khan Academy
Khan Academy: Positive and Negative Linear Associations From Scatter Plots
Practice identifying the types of correlations shown in scatter plots. Sometimes we see linear correlations (positive or negative), sometimes we see non-linear correlations (the data seems to follow a curve), and other times we don't see...
Illustrative Mathematics
Illustrative Mathematics: S Id Math Test Grades
Ari has collected data on how much her classmates study each week and how well they did on their recent math test. Here is part of the data showing the percentage of each group (divided according to hours spent studying) who got B's or...
Illustrative Mathematics
Illustrative Mathematics: S Id Golf and Divorce
This is a simple task addressing the distinction between correlation and causation. Students are given information indicating a correlation between two variables and are asked to reason out whether or not a causation can be inferred.
Illustrative Mathematics
Illustrative Mathematics: S Id Coffee and Crime
This task addresses many standards regarding the description and analysis of bivariate quantitative data, including regression and correlation. Given a scatter plot, students will answer a variety of questions about linear relationships,...
Illustrative Mathematics
Illustrative Mathematics: 8.sp Birds' Eggs
A scatter plot showing data for the sizes of birds' eggs is presented. Students are to look for correlations and make predictions whose values fall within the data range. They are also to make generalizations about the characteristics of...
CK-12 Foundation
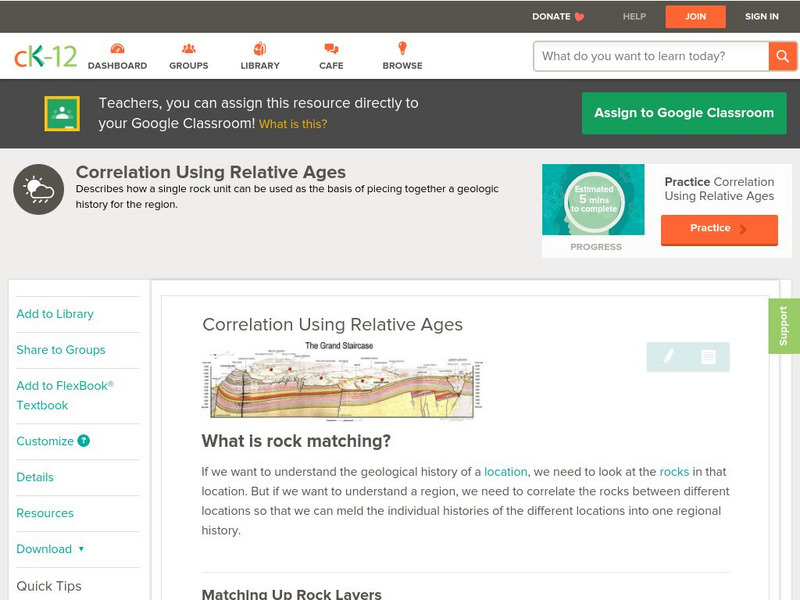
Ck 12: Earth Science: Correlation Using Relative Ages
[Free Registration/Login may be required to access all resource tools.] How rock layers in different locations can be connected to make pictures of a region's geology.
CK-12 Foundation
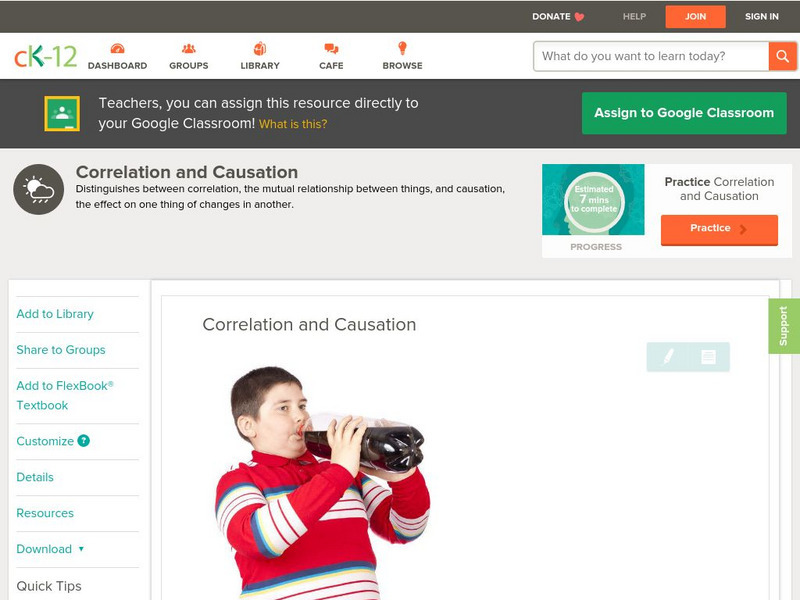
Ck 12: Earth Science: Correlation and Causation
[Free Registration/Login may be required to access all resource tools.] Examines the difference between correlation and causation.
CK-12 Foundation
Ck 12: Earth Science: Correlation and Causation
[Free Registration/Login may be required to access all resource tools.] Examines the difference between correlation and causation.
CK-12 Foundation
Ck 12: Earth Science: Correlation and Causation
[Free Registration/Login may be required to access all resource tools.] Examines the difference between correlation and causation.
CK-12 Foundation
Ck 12: Statistics: Linear Regression Equations
[Free Registration/Login may be required to access all resource tools.] Use a calculator to create a scatter plot and to determine the equation of the line of best fit.
CK-12 Foundation
Ck 12: Earth Science: Correlation Using Relative Ages Study Guide
This comprehensive study guide covers the main terms and concepts needed for an earth science unit on correlation using relative ages. Review questions are included at the bottom of the study guide.
CK-12 Foundation
Ck 12: Earth Science: Correlation and Causation Study Guide
This comprehensive study guide covers the main terms and concepts needed for an earth science unit on the scientific principles of correlation and causation. Review questions are included at the bottom of the study guide.
Shodor Education Foundation
Shodor Interactivate: Multiple Linear Regression
Students compare multiple independent variables as predictors of one dependent variable. Students explore correlation and lines of best-fit.
Shodor Education Foundation
Shodor Interactivate: Regression
Plot a bivariate data set, determine the line of best fit for their data, and then check the accuracy of your line of best fit.
Khan Academy
Khan Academy: Types of Flaws
On the LSAT (as well as in real life), you'll encounter some types of flawed arguments more often than others. This article features some of the flaws that you're most likely to see on Test Day. The faster you can recognize these common...
Khan Academy
Khan Academy: Types of Evidence
It can be useful to separate and identify different types of evidence used in an argument to support a conclusion. There are many ways to support a conclusion; this article will walk through some of the most common ones that you may see...
Shodor Education Foundation
Shodor Interactivate: Linear Regression and Correlation
Students are introduced to correlation between two variables and the line of best fit.


