Mathed Up!
Cumulative Frequency and Box Plots
Learn how to display data. Young data analysts watch a video to review how to create cumulative frequency histograms and box plots. They work on a set of questions to practice producing these data displays.
Shodor Education Foundation
Shodor Interactivate: Lesson: Algorithm Discovery With Venn Diagrams
The lesson plan, with objectives, lesson outline, and interactive resources, helps students learn about algorithms using box plots and Venn diagrams.
Annenberg Foundation
Annenberg Learner: Learning Math: Min, Max and the Five Number Summary
Explore how to interpret a large set of data by dividing it up into smaller portions in order to answer statistical questions.
Other
Online Statistics Education: Graphing Distributions [Pdf]
This is the second chapter of a statistics e-text developed collaboratively by Rice University, University of Houston Clear Lake, and Tufts University. It looks at many different types of data displays and the advantages and...
US Census Bureau
Us Census: Percentage of People Who Walk to Work in Cities and Population Size
Using census data, young scholars will create box plots to make inferences about the percentages of people who walk to work in cities of different population sizes (small, medium, and large). Students will use these findings to write a...
Shodor Education Foundation
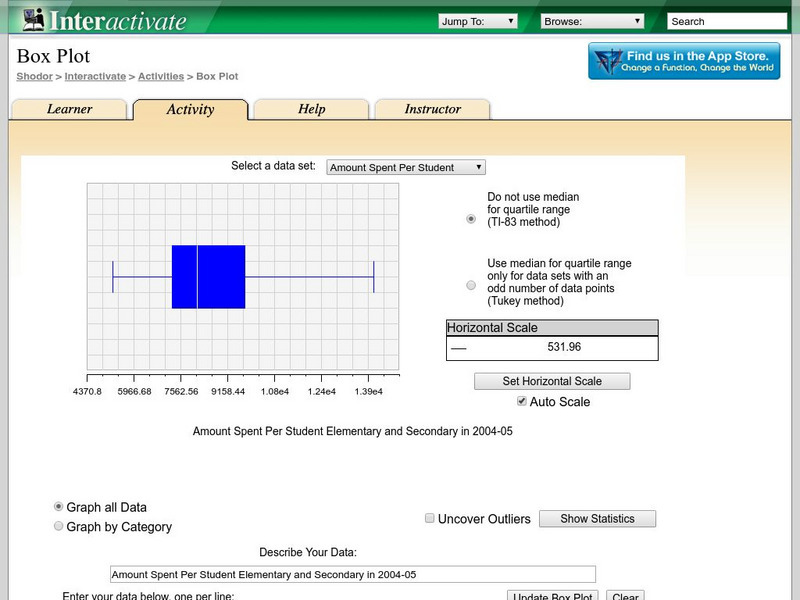
Shodor Interactivate: Box Plot
Students learn about box-and-whisker plots. The interactive box plot allows the user to explore maximum, minimum, median, upper quartile, lower quartile, and outliers.
Texas Instruments
Texas Instruments: Get on the Stick
In this activity, students use a CBR 2 to measure the reaction time of catching a stick. They also learn how to interpret a box plot, and make a five number summary of a single variable data set.
Texas Instruments
Texas Instruments: How Tall? Describing Data With Statistical Plots
In this activity, students' will measure their heights using a motion detector and describe the data using the statistical concept called box plot.
Texas Instruments
Texas Instruments: Box Plots: How Many Pairs of Socks
The purpose of this lesson is to help students use the shape of a line plot to interpret the shape of a box plot.
Other
Nmu: Boxplot Introduction
This site provides an excellent introduction to boxplots. Additional links related to components of boxplots are included.
Khan Academy
Khan Academy: Reading Box Plots
Practice reading information presented in box plots. Students receive immediate feedback and have the opportunity to try questions repeatedly, watch a video or receive hints.
Annenberg Foundation
Annenberg Learner: Drawing a Box Plot
Learn how to represent the Five-Number Summary graphically using a box plot.
Shodor Education Foundation
Shodor Interactivate: Lesson: Box Plots
This lesson plan introduces quartiles and box plots. It contains an activity and discussion. Supplemental activities about how students can represent data graphically are also included.
Khan Academy
Khan Academy: Creating Box Plots
More practice making box plots to summarize data sets. Students receive immediate feedback and have the opportunity to try questions repeatedly, watch a video or receive hints.
CK-12 Foundation
Ck 12: Types of Data Representation: Graphic Displays of Data
[Free Registration/Login may be required to access all resource tools.] Here you will explore displays of data using bar charts, histograms, pie charts and boxplots, and learn about the differences and similarities between them and how...
Illustrative Mathematics
Illustrative Mathematics: S Id Haircut Costs
This lesson plan could be used as an introductory lesson plan to introduce group comparisons. Being able to use data to compare two groups is an important skill. Students will sketch box plots using the data given about the cost of...
Illustrative Mathematics
Illustrative Mathematics: S Id.1,2,3 Speed Trap
A statistically-minded state trooper wondered if the speed distributions are similar for cars traveling northbound and for cars traveling southbound on an isolated stretch of interstate highway. Students will use the data collected by...
Illustrative Mathematics
Illustrative Mathematics: S id.a.3 Identifying Outliers
In this task, students are asked to construct a box plot of the distances they live from school and describe the main features of the distribution. The purpose of this task is to develop students' understanding of how extreme data points...
Better Lesson
Better Lesson: Box and Whiskers... Analyzing and Creating
The students will be using discovery techniques to learn about box and whisker plots.
Better Lesson
Better Lesson: Box and Whiskers Activity
The students will be working in stations to construct and analyze box plots. All activities are of high interest and rich in content.
National Council of Teachers of Mathematics
Nctm: Illuminations: Box Plotter
Use this applet to create a customized box plot with your own data, or display a box plot of an included set of data.
Shodor Education Foundation
Shodor Interactivate: Box Plot
Students can create box plots for either built-in or user-specified data as well as experiment with outliers. User may choose to use or not use the median for calculation of interquartile range.
Louisiana Department of Education
Louisiana Doe: Louisiana Believes: Eureka Math Parent Guide: Statistics
A guide to support parents as they work with their students with statistics.
Other
Nearpod: Displaying Data: Box Plots
In this lesson, students will learn how to create and intrepret box plots using the 5-number summary.


