Curated OER
Survey and Tally
Second graders view a model of a survey and tally. In this survey and tally lesson plan, 2nd graders decide on questions for a survey. Students conduct the survey and tally their results. Students create a tally chart. Students view a...
Curated OER
Collecting Data to Learn About the People Around You
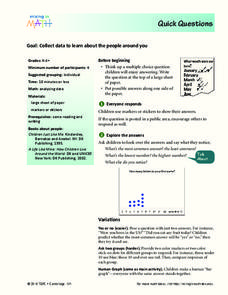
Human graphs, anyone? Did you eat fruit today? What is your favorite costume? Have your K – 6 learners graph the responses. Early elementary grades may count and compare while upper grades compare responses of different groups or make...
Berkshire Museum
Reduce, Reuse, and Recycle: Sorting Through Personal Choices
Raise children's awareness about the importance of conservation with this hands-on science lesson plan. Start by breaking the class into groups and having them collect trash from around the school or local park. Students then use the...
Curated OER
Graphing
Learners investigate graphing. In this bar graph lesson, students view an informational website about graphing, then construct a class birthday bar graph outside with sidewalk chalk. Learners choose a survey topic, then collect data and...
Curated OER
One Square Meter
Learners examine various ecosystems using scientific inquiry. Using the local area, they assess the characteristics and conditions in one square meter. They report their findings in the form of a survey map and data sheet. They...
Curated OER
Quick Questions
Students ask their classmates survey questions. In this survey lesson, students come up with a question and possible answers. Their classmates mark their answers and the class discusses what they notice.
Curated OER
Graphing Favorite Holidays
Students create spreadsheets and bar graphs based on results of survey of favorite holidays.
Curated OER
Too Heavy For Me
Students explore the different arrangement of air molecules in high and low air pressure masses. They compare the temperature of high and low pressure masses and discover how a barometer works.
Curated OER
We Care About Fire Safety
Students investigate the hazards of fires and how to best protect themselves and their family. In this home safety lesson, students examine the importance of a smoke detector and discover how many homes are missing them among their...
Curated OER
Graphing Our Favorite Candy Bars
Students use ClarisWorks to graph class' favorite candy bars on a bar graph.
Curated OER
Geological Development of Indiana and the Movement of Peoples Across the State
Learners are introduced to the geological development of the state of Indiana. Using the internet, they visit the U.S. Geological Survey and locate the earthquake zones in the state. In groups, they locate and identify the energy...
Curated OER
Graphing Pockets
Second graders explore graphing. They count the number of pockets on their clothes and use Microsoft Excel to enter their data. Students create a class graph displaying their findings.
Curated OER
The Gathering and Analysis of Data
Young mathematicians gather data on a topic, graph it in various forms, interpret the information, and write a summary of the data. They present their data and graphs to the class.


