Curated OER
Where Did the Bunny Leave the Eggs? Picture Graphing Activity
The Easter Bunny left us a bunch of eggs, but how many did he leave? Learners use the data to create a picture graph, interpret it, and answer the questions that follow. There's even easy egg cut-outs for your youngsters!
Curated OER
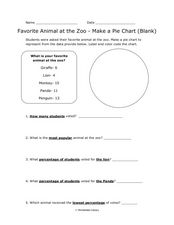
Pie Chart: Favorite Animal at the Zoo
In these three interpreting a pie chart and answering questions worksheets, students use the data provided to label and color code the blank and outlined pie charts, read and interpret a completed pie chart, and then answer questions...
Curated OER
My Test Book: Reading Graphs
For this online interactive math skills worksheet, students solve 10 multiple choice math problems that require them to read and interpret graphs. Students may view the correct answers.
Curated OER
Jim, Tony, and Frank-The School Fund-raiser (Graphing)
In this graphing learning exercise, students view a pie chart. Students use their graphing knowledge to interpret the pie chart and answer ten questions. There is an answer sheet.
Curated OER
Favorite Animal at the Zoo - Making a Pie Chart
In this graphing and interpretation worksheet set, learners draw charts that are either blank or outlined that show information about students' favorite zoo animals. They answer questions based on the data in 15 examples.
Curated OER
My Test Book: Tally Charts
For this online interactive math worksheet, students solve 10 problems that require them to read and interpret tally chart data. Students may submit their answers to be scored.
Curated OER
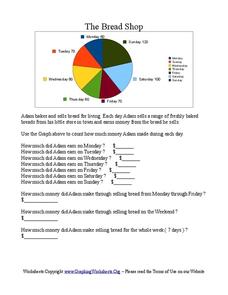
The Bread Shop
In this pie chart worksheet, learners use the pie chart graph to count the money Adam made in the Bread Shop. Students complete 10 questions.
Curated OER
Cindy and Linda - Selling Lemonade
In this pie charts worksheet, learners use the pie chart to count how many glasses of Lemonade were sold by Cindy and Linda. Students complete the table and answer 3 questions.
Curated OER
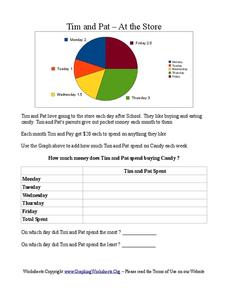
Tim and Pat - At the Store
In this pie chart activity, students use the pie chart to add the amount of time Tim and Pat spend buying candy each day of the week. Students answer 2 questions about the table.
Curated OER
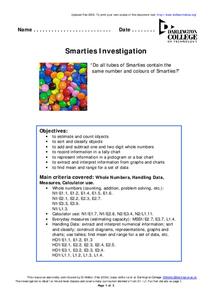
Smarties Investigation
In this math worksheet, students participate in an investigation of Smarties candy. For example, students estimate how many candies they have in each color, count the actual number, and record the information in a tally chart.


