Illustrative Mathematics
Overlapping Rectangle
Challenge young mathematicians' ability to compose and decompose shapes with this fun geometry puzzle. The goal is simple, locate all of the rectangles shown in a picture of three overlapping rectangles. Perform this activity as a whole...
Alberta Learning
Equivalent Fractions: Activity Sheet
Provide learners with practice for identifying equivalent fractions. The first worksheet contains 15 problems that instruct pupils to name fractions based on visuals, and to find missing parts to equivalent fractions. In the second...
Center for Mathematics and Technology
Whole Numbers: Using an Area Model to Explain Multiplication
There are many ways to work through a multiplication problem. Using an area model, kids complete several worksheets with different types of multiplication problems, including multiplying by ten, and explain how the new strategies differ...
Readington Township Public Schools
Facts Practice Using Multiplication/Division Fact Triangles
Why waste time teaching multiplication and division facts separately, when this resource allows you to cover both concepts at once. Displaying the fact families for all single-digit factors, these triangle shaped flash cards are a great...
National Security Agency
Starting a Restaurant
Through an engaging unit, chefs-in-training will sort and classify data using tally charts. Learners will also create bar graphs to display restaurant data and interpret data from bar graphs using a variety of categories. This is a fun...
Mathed Up!
Reading Scales
After watching a video on how to read different types of scales, young mathematicians complete eight problems involving scales. From thermometers to number lines to rulers and clock, class members identify various numbers on scales.
Mathed Up!
Addition and Subtraction
After watching a brief video on addition and subtraction, young mathematicians are put to the test. Including 12 problems, individuals solve word problems to find the least number, total amount, and difference of numbers.
Mathed Up!
Pictograms
Young mathematicians read, interpret, and complete a variety of real-world pictograms. Each question includes a key and information to complete the graphs.
Illustrative Mathematics
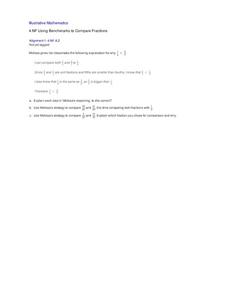
Using Benchmarks to Compare Fractions
Introduce a new strategy for comparing fractions by analyzing Melissa's use of benchmarks. Walk the class through her process, calling on learners to explain their understanding of each step she took. Then practice this method on two...
Math Worksheets Land
Reading and Making Pie Graphs Worksheets
The opportunities are endless with a collection of five worksheets that enable young mathematicians to read pie graphs. Individuals use graphs to answer eight multiple choice questions on each sheet. The set of five allows for continued...
Mathed Up!
Ordering Fractions, Decimals, and Percentages
Give scholars the opportunity to show what they know about ordering fractions, decimals, and percents with a five-page, eight-problem independent practice. With clear instructions and supportive advice, learners are bound for a...
Cassandra Reigel Whetstone
Farmer McPeepers and His Missing Milk Cows
Pair your reading of Farmer McPeepers and His Missing Milk Cows with the questions and activities provided here. Learners answer questions about the text, create story maps, put together brochures, relate math to the story, practice some...
Curriculum Corner
Editable Exit Tickets
Here is a resource with 28 different exit ticket formats that can be used across the curriculum. Opportunities for exit assessments are endless with various prompts such as, "2 facts I learned today are..." or "I need extra help with..."...
Curated OER
R & R - Incorporating Literature While Teaching Math - Ordered Pairs - "The Polar Express"
Third graders create pictures using ordered pairs after listening to a piece of literature. In this ordered pairs and literature lesson plan, student listen to and discuss The Polar Express by Chris Van Allsburg. They participate in...
Curated OER
Make the Correct Times On Each Clock
Nine blank clocks are awaiting to receive their hands on this time-telling worksheet. Students are given a time, which they must correctly represent on each clock. This would be a great assessment worksheet.
Math Salamanders Ltd.
Multiplication Tables to 10 x 10 Sheet 3
A straightforward worksheet asks mathematicians to fill the blanks in 30 multiplication problems. In some cases, a factor is missing from the sentence, and in others, the product is missing. This would be an ideal assessment after...
Curated OER
Area and Perimeter of Rectangles
Discover the difference between area and perimeter. Learners are grouped in twos and threes and each group has one advanced/gifted learner to serve as the peer helper. They receive manipulatives to help them determine the area and...
Ohio Department of Education
Fraction Models - Grade Three
Explore fractions using different manipulatives and illustrations. Your class can create a variety of models of fractions and mixed numbers with drawings and manipulatives. They then work to compare fractions, mixed numbers, and whole...
Garden of Praise
George Washington Carver Test
This is a standard multiple-choice assessment on the life and ideas of George Washington Carver. It includes 20 questions on topics covering information about his birth and education, major career moves, teaching principles, ethics, etc.
Curated OER
Candy Bar Measurements
Geometers explore mathematics by completing an object measurement worksheet. They utilize a variety of candy bars and rulers to conduct a measurement experiment in class. They complete worksheets as a group based on the measurement...
Curated OER
Dribbling Math Challenge
Students practice foot dribbling and hand dribbling with control. In addition it helps to reinforce math concepts.
Curated OER
Numeracy Assessment
For this math worksheet, students solve a variety of problems related to Christmas. For example, students complete a multiplication chart and count how many days are left until Christmas.
American Statistical Association
Candy Judging
Determine the class favorite. The statistics lesson plan has pupils collect, display, and analyze data. Pairs rank four kinds of candy based on their individual preferences. Working as an entire class, learners determine a way to display...
American Statistical Association
The Taste of Yellow
Does lemonade taste better when yellow? A tasty experiment has scholars determine the answer to the question. It requires conducting a taste test with lemonades of different colors (from food coloring), and then collecting and analyzing...
Other popular searches
- Math Assessment on Coins
- Elementary Math Assessments
- Math Assessment Test
- Math Assessment Fractions
- Cumulative Math Assessment
- Fitness Assessment Math
- Baseline Math Assessment
- Third Grade Math Assessment
- First Grade Math Assessment
- Grade 4 Math Assessment
- Math Assessment Questions
- Basic Math Assessment


