Curated OER
Picture Graphs
Are your youngsters learning how to read picture graphs? Use these five examples to asess your learners' comprehension. Consider rearranging them differently; the presentation is slightly congested.
Curated OER
Complete the Graphs
First, second, and third graders make pictographs. There are four graphs to complete, and the answer sheet is included. Consider providing your learners with special needs two sets of stickers to use, instead of requiring them to draw...
Curated OER
Read a Picture Graph
It's the Bears vs. the Seals! Who is the season winner? Read this data and have your math class answer the six questions that follow. Consider graphing the chart as a class, or encouraging individuals to graph it before answering the...
K12 Reader
Showing Data on a Graph
Here's a learning exercise that not only introduces kids to graphing, but also is designed as a reading comprehension activity. After reading the article about graphing, kids respond to a series of questions based on the article.
Baylor College
Air: The Math Link
Inflate this unit on the science of air with these math skills practice and word problems. Accompanying the children's story Mr. Slaptail's Secret, this resource covers a wide range of math topics including the four basic operations,...
Curated OER
Graphs to Represent a Data Set
As your scholars begin to learn how to read graphs, help them pay attention to detail with this matching activity. They read four short data descriptions and match them to one of the four bar graphs pictured. Each graph is labeled along...
Curated OER
Statistics Problems
In this statistics learning exercise, 3rd graders answer questions about different graphs including bar graphs, picture graphs, line graphs, and more. Students complete 20 multiple choice questions.
Curated OER
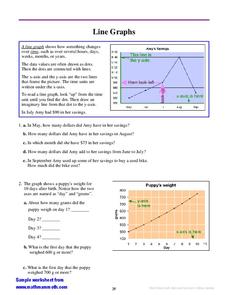
Line Graphs
In this interpreting line graphs worksheet, students read an explanation and observe an example of a line graph and its parts and then answer questions interpreting two line graphs. Students write eleven answers.
Mathed Up!
Pictograms
Young mathematicians read, interpret, and complete a variety of real-world pictograms. Each question includes a key and information to complete the graphs.
K12 Reader
Displaying Data
It's important to learn how to display data to make the information easier for people to understand. A reading activity prompts kids to use context clues to answer five comprehension questions after reading several paragraphs about...
K12 Reader
What Is a Glyph?
After reading a short passage about glyphs, kids must follow the provided directions to create a star glyph.
Curated OER
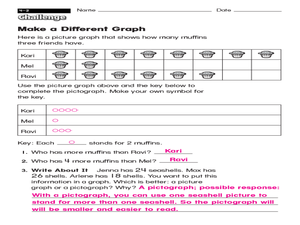
Make a Different Graph
What is the difference between a picture graph and a pictograph? Young learners are given a picture graph detailing how many muffins three friends have, and they must complete a pictograph using a symbol of their choice. An answer key is...
Public Schools of North Carolina
Math Stars: A Problem-Solving Newsletter Grade 3
Make sure your class stays up with the times using this series of math newsletters. Including word problems that cover topics ranging from consumer math and symmetry to graphing and probability, these worksheets are a fun way to...
Public Schools of North Carolina
Math Stars: A Problem-Solving Newsletter Grade 2
Develop the problem solving skills of your young learners with this collection of math newsletters. Covering a variety of topics ranging from simple arithmetic and number sense to symmetry and graphing, these worksheets offer a nice...
Worksheet Web
Using Pictographs
If one ice cream cone represents three ice cream scoops, and Bob has four ice cream cones, then how many scoops does Bob have? Learners solve these kind of questions with their new understanding of pictographs.
Curated OER
The Egg Hunt- Using a Graph to Answer Data Questions
In this pictograph instructional activity, learners answer questions based on a pictograph that shows colored Easter eggs. They follow the key that shows that each egg picture is equal to 10 eggs. They fill in the blanks with answers to...
Curated OER
Graphing Ordered Pairs
In this math worksheet, students learn to graph ordered pairs. Students examine a graph with 3 labeled points and tell the ordered pairs for each. Students also plot 8 ordered pairs on a graph they draw themselves.
Curated OER
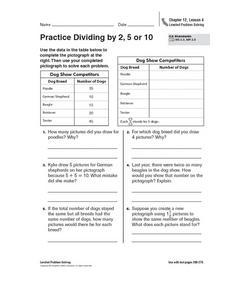
Practice Dividing by 2, 5, or 10
In this pictograph problem solving worksheet, students analyze the data on a table and create a pictograph. Students read and solve 6 story problems about the pictograph.
Curated OER
Melissa's Garden
In this math activity, students identify the location of pictures on a coordinate plane. They write some answers as an ordered pair. They read ordered pairs and identify the picture at a specified location. Six problems are on a page. An...
Public Schools of North Carolina
Math Stars: A Problem-Solving Newsletter Grade 1
Keep the skills of your young mathematicians up-to-date with this series of newsletter worksheets. Offering a wide array of basic arithmetic, geometry, and problem solving exercises, this resource is a great way to develop the critical...
Computer Science Unplugged
Colour by Numbers–Image Representation
How do computers store and send images? Here's an activity that explains one way a computer can compress image information. Pupils decode run-length coding to produce a black and white image. Pairs then work together to code and decode...
Curated OER
Problem Solving: Use a Table Reteach 16.8
In this problem solving worksheet, students learn to look for information in a data table. Students answer 6 questions about a data table.
Curated OER
Back To School Crossword
In this reading worksheet, students analyze 10 words which pertain to Back to school time. Students read clues and fit the words in the crossword puzzle.
Education World
Every Day Edit - Chris Van Allsburg
In this everyday editing worksheet, students correct grammatical mistakes in a short paragraph about the author of The Polar Express and Jumanji, Chris Van Allsburg. The errors range from capitalization, punctuation, spelling, and grammar.


