The Math League
The Math League: Percent and Probability: What Is a Percent?
This site defines a percent, explains it as a fraction and decimal, and shows how to estimate a percentage.
PBS
Pbs Learning Media: Hacker's Four Zergen Game
In this video segment from Cyberchase, the CyberSquad determines the fairness of a game in which there are three shapes distributed equally on nine squares.
University of Cambridge
University of Cambridge: Nrich: Game Do You Measure Up?
This interactive game gives you a variety of measuring tools and measuring opportunity. For this game of chance you choose the correct tool for the job that needs to be measured. Everything you need for this game is listed and/or...
University of Cambridge
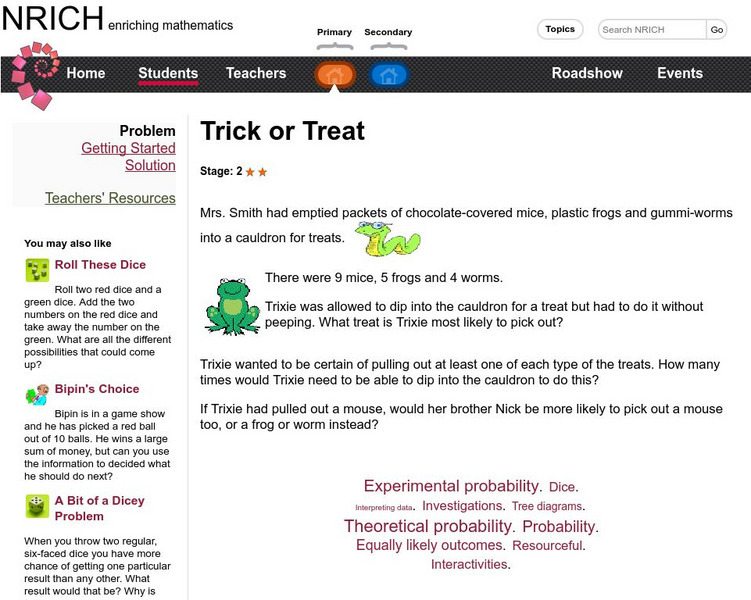
University of Cambridge: Nrich: Trick or Treat
On this one page website sharpen your logic, graphing and pattern recognition skills while working on this challenge. The solution is available to double check your solution.
Annenberg Foundation
Annenberg Learner: Making a Stem and Leaf Plot
A line plot may not be a useful graph for investigating variation so we must come up with a new representation based on groups of data. Construct a stem and leaf plot from a set of 26 data values.
Annenberg Foundation
Annenberg Learner: Organizing Data in a Stem and Leaf Plot
A stem and leaf plot is a graphical representation for investigating variation. You will convert an ordered stem and leaf display grouped by tens into an ordered display grouped by fives.
Other popular searches
- Fun Math Probability Games
- Probability/math Literature
- Smart Board Math Probability
- Grade 1 Math Probability
- Math Probability Vocabulary
- Math Probability Worksheets
- Sport Math Probability
- Math Probability Factorial
- Math Probability Games
- Grade 4 Math Probability
- Math Probability Lessons
- Probability and Sports Math


