Curated OER
All Aboard!
Young scholars are placed in the position of the person who orders supplies for the ship. They calculate quantities required for a variety of items, and then to convert such quantities into dollars.
Curated OER
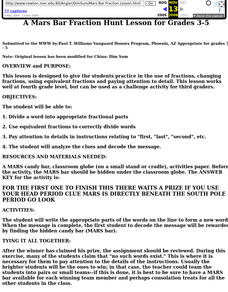
China: Dim Sum: A Mars Bar Fraction Hunt Lesson
Students practice in the use of fractions, changing fractions, using equivalent fractions and paying attention to detail.
Curated OER
Closing the Case
Fifth graders collect data and prepare data displays using a survey with statistical information.
Curated OER
Worth Their Weight
Students weigh various circulating coins in grams, and record their findings on a data chart for comparisons. They compare weights of coins and use subtraction of decimals to find the difference.
Curated OER
Linguistic Diversity
Students complete a handout dealing with the languages spoken most frequently at home in Canada. They interview a person with a home language other than English or French. Students contribute to a bulletin board display representing...
Curated OER
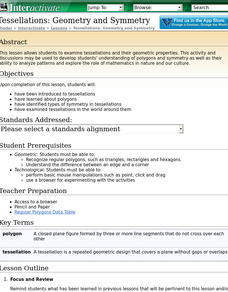
Geometry and Symmetry
Students examine tessellations and their geometric properties. The lesson and discussions may be used to develop students' understanding of polygons and symmetry as well as their ability to analyze patterns.
Curated OER
Fairytale Favorites
Students access George MacDonald's Fairytales website, read exerpts of pre-selected tales, select their favorite and communicate that information via the internet to another class.
Curated OER
True Grid
Students explore probability by predicting the probability of the occurrence of each color in a sample of M&Ms.
Curated OER
Interpreting and creating tables
Students observe examples and discuss how to interpret them. They then
brainstorm examples of possible questions students could use to create a table. They take time to formulate a question and collect data.
Curated OER
The Key to Word Problems
Students learn the key words to look for in multiplication and division word problems, to help them decide which operation to use. They analyze, wrte, and solve multiplication problems.
Curated OER
How Different Are We from Other Students?
Fifth graders make bar graphs from data that they have collected. They have been writing to pen pals in Spain for a couple of months and received a survey back from them. They put all the data together that they collected.
Curated OER
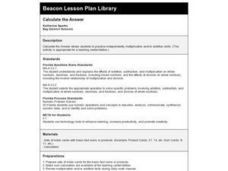
Calculate the Answer
Young scholars solve basic multiplication or addition facts using a calculator and product cards. They draw a card, read the sum or product, and press single digits on the calculator to display the number on the card.
Curated OER
Graphs Abound
Students create a survey for their classmates to collect data on their favorite foods, eye color, pets or other categorical data. They compile the data from the survey in a table and then make a bar graph of each category using a web tool.
Curated OER
Stem-and-Leaf Plots
Students are introduced to stem-and-leaf plots and calculating the mean, median, and mode from the plots.
Curated OER
The Great Chile Challenge
Fifth graders gather data, create a graph, and interpret information. They build vocabulary by negotiating the ideas that go into the graphs which they create. They use Excel to print a variety of graphs based on how much they like Chile...
Curated OER
Divided We Stand
Learners figure out how to arrange seating in a concert hall given specific requirements. They better explain how dividing can allow us to arrive at mathematical solutions quickly and logically.
Curated OER
Triangle Explorer
Young scholars calculate the area of triangles using a variety of materials including computer applets.
Curated OER
Rocket Construction
Students create rockets out of wood. They practice using comparison words to describe the differences in height. They also color pictures of rockets from different countries.
Curated OER
Launch Time
Learners create and launch their own paper rockets. They complete graphs to show distances. They discuss what modifications could be made to make it go further.
Curated OER
Geometric Figures
Students identify two and three dimensional shapes and use appropriate geometric vocabulary to write a description of the figure by taking pictures of geometric figures in their own environment.
Curated OER
All Those Advertising Dollars!
Students calculate percent increases (or percent decreases) for the top 25 companies in terms of advertising dollars spent during a year.
Curated OER
Opening the Case
Young scholars participate in a class survey and then design an experiment and use graphs and statistics to assist them in solving a problem. They organize the results of the survey in a stem-and-leaf plot and find the range, median,...
Curated OER
Collecting, organizing and comparing data for cellular telephone buying and calculating average, and median price and best deal per cost.
Students research data and develop statistical methods such as mean and median price and make convincing arguments as powerful ways for decision making.


