Curated OER
Mapping an Artifact
Young scholars copy a present day artifact onto graph paper. In groups, they decide the scale of the drawing and create the picture using specific graphing points. They are also given photographs in which there are no graphing points and...
Curated OER
How Much Will This Cost?
Young scholars determine how much money is needed for a service learning project. They create a graph or chart to explain the budget for the service project. They complete budget worksheets as their plan goes into action.
Curated OER
All of Me
Students draw pictures showing some of the different aspects of their lives, and share the pictures with classmates.
Curated OER
Civil War Time Line
Pupils draw a time line on graph paper on a scale of one square to every five years beginning in 1770 and ending at 2000. They place historic events and inventions in their correct time period on the time line, and add their birthday to it.
Curated OER
Time, Tide, and Quahogs
Students read tide tables for Waquoit Bay as the simulate determining the best time to go clam digging for a Wampanoag clambake. They graph the tide tables while realizing that the tides a Waquoit Bay are one hour later than those at...
Curated OER
Geometric Figures
Students identify two and three dimensional shapes and use appropriate geometric vocabulary to write a description of the figure by taking pictures of geometric figures in their own environment.
Curated OER
What is a Tropical Rainforest?
Students investigate amounts of rainfall in selected world rainforests by creating a bar graph showing rainfall in inches for each. They convert inches to millimeters, and solve word problems having to do with rainfall in selected world...
Curated OER
Inventors Unit Survey
Students develop and conduct a survey for their inventors unit. They create a five question survey and tally the survey results, and create a graph using Microsoft Word and Graph Club 2.0.
Curated OER
Sink or Float?
Students predict and explore to discover which objects sink or float in fresh and salt water, predict how salt affect objects, write predictions on T chart, discuss difference between man-made and natural waters, and graph results.
Curated OER
Off to College
Learners jog to where their classroom teacher went to college using a scale that best fits their situation. They log miles on a chart until students reach their destination. Learners use the colleges mascot as the graph indicator as to...
Curated OER
How's the Weather?
Students explore earth science by researching the Internet. In this weather pattern lesson plan, students utilize the website weather.com to analyze the weather in different geographic locations. Students view charts and graphs based on...
Curated OER
Memory Book - A Cooperative Learning Experience
Students document sections of their life through pictures, stories, and video to create an English "memory book". They use photographs, video and edited video which includes their history, includes calculated growth, and genetic...
Curated OER
The "Coal LIfecycle" Scrapbook
Students discover how coal is formed. In this science lesson plan, students create a scrapbook on the life cycle of coal and show how coal is formed by showing pictures of each stage.
Curated OER
Effects of Ozone in the Air
Fifth graders learn how ground-level ozone is an air pollution problem. Students measure ozone levels and graph the results.
Curated OER
In a Family Way
Students research a rare species of animals that are a step away from the well known animals of our zoos. They create a mobile which displays the geography, habits, population and habitat of the animals. They draw a picture.
Curated OER
Community Construction Kit
Students engage in a lesson plan designed to be used with the Print Gallery section in the Community Construction Kit. The Print Gallery is a library of photographs, which provides students with an auditory description of each dwelling...
Curated OER
From Slavery to Segregation
Pupils study the causes and effects of slavery and segregation. They write an essay (including either pictures, charts, graphs or copies of documents to support their essay) which addresses the African American's journey from slavery to...
Curated OER
Can You Name that Town
Students, after becoming familiar with different names of towns in Arkansas, practice using a map grid and map index.
Curated OER
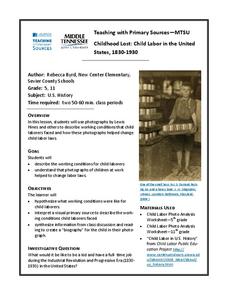
Childhood Lost: Child Labor in the United States, 1830-1930
Working in groups, middle and high schoolers describe and discuss photographs depicting working conditions experienced by child laborers in the 19th century. They then write a persuasive paragraph supporting an amendment to regulate the...
Curated OER
Sampling the Ocean Floor
Students sample goodies from an unseen ocean floor and try to accurately describe their composition. This simulation helps students explain the limitations of sampling and the problem of obtaining representative samples of sea floor...
Curated OER
Where Has It Been? Tracking the Ivory-Billed Woodpecker
By studying the assumed extinction, and subsequent rediscovery of the Ivory-billed Woodpecker, learners use maps and come up with a scenario for the rediscovery of the bird. This incredibly thorough lesson plan is chock-full of...
Curated OER
Shaquille O'Neal Hand/Foot Span: Student Worksheet
Here's a clever math worksheet that has learners measure their hand span, foot length, come up with a ration, then use that information to figure out the hand span, and foot length of basketball giant Shaquille O'Neal. A good activity!
Curated OER
House Project
Make young mathematicians' dreams a reality with this fun drawing project. Given the task of designing their dream home, students create drawings and physical models that demonstrate their understanding of proportion and scale.
Noyce Foundation
Time to Get Clean
It's assessment time! Determine your young mathematicians' understanding of elapsed time with this brief, five-question quiz.
Other popular searches
- Coordinate Picture Graphs
- Christmas Picture Graphs
- M&m Picture Graphs
- Hidden Picture Math Graphs
- Picture Graphs Worksheets
- Math Lessons Picture Graphs
- 5th Grade Picture Graphs
- Bar and Picture Graphs
- Thanksgiving Picture Graphs
- Circle and Picture Graphs
- Picture Graphs Template
- Reading Picture Graphs


