Illustrative Mathematics
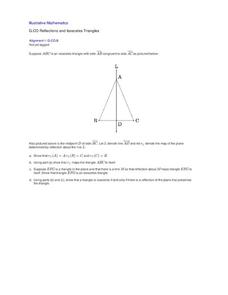
Reflections and Isosceles Triangles
Geometers explore symmetries of isosceles triangles by using rigid transformations of the plane. They complete four tasks, including congruence proofs, which illustrate the relationship between congruence and rigid transformations. The...
Curated OER
Tuberculosis Project
Reasearch the transmission of tuberculosis and design a communication product to help youth understand the risks of the disease, how it is tested for, and the benefits of proper treatment. This project incorporates language arts, math,...
Curated OER
Probability: The Study of Chance
Students conduct an experiment, determine if a game is fair, and collect data. They interpret data, then display line graph. They conduct analysis of game for probability.
Curated OER
Newton's Laws of Motion
Ninth graders utilize Newton's Laws of Motion to explain how things move, create poster illustrating each law of motion, and present and explain their poster to classmates.
Curated OER
"Mind Reader" Math Trick
Students perform a math-based card trick and explain the concepts behind the trick. They video tape classmates performing the trick. Finally, they write a paragraph explaining the trick.
Curated OER
Inequalities and The Order of Operations
Middle and high schoolers investigate how to solve inequalities. The lesson has a good guide for taking pupils through a direct instruction of the concept. You can use counting tiles in order to help kinesthetic learners.
Curated OER
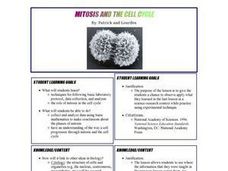
Mitosis And the Cell Cycle
Students determine the approximate time a cell spends in each phase of mitosis by counting cells in each phase from a prepared slide. They use a few simple calculations to estimate how long cells spend in each cycle in the body.
Curated OER
Your Tax Dollars at Work
In order to understand how tax dollars are spent, young economists use given data and graph it on a circle graph. Circle graphs are highly visual and can help individuals describe data. A class discussion follows the initial activity.
Curated OER
Picture This: Election Results Graphs
Students use art supplies or a free online tool to graph election results. Students follow local election and results. Using "Create a Graph, a free online graphing tool, they make a graph of the results.
Curated OER
Cool Liquids
Chemistry neophytes use a temperature probe to assess the change as five different liquids evaporate. The implantation section suggests that they take readings every five seconds for a total of four minutes. They graph the data, look up...
Curated OER
Order of Operations
In this order of operations worksheet, students solve problems that include all four operations, parenthesis, square roots, and more. Students complete 50 problems.
Curated OER
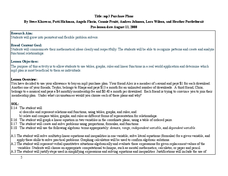
MP3 Purchase Plans
Use algebra to solve real world problems. Mathematicians practice use of graphs, tables, and linear functions to solve a problem regarding mp3 purchase plans. They work in groups to solve the problem and present their findings and...
Curated OER
Biotechnology
A continuous cascade of information comes through this PowerPoint on biotechnology. The topic is defined, a history is presented, and basic genetic engineering techniques are explained. The topic is covered in an objective manner,...
Curated OER
Real Number System
Ninth graders discuss the real number system and its' properties. In this algebra lesson, 9th graders discuss rational, irrational, closure, real numbers and the distributive property of algebra. They solve problems using these...
Curated OER
Introduction to Fractals: Infinity, Self-Similarity and Recursion.
This lesson introduces high schoolers to the ideas involved in understanding fractals. They develop a sense of infinity, self-similarity and recursion and
Curated OER
Infrared-Hot
Students describe how the sun heats the Earth, explain the nature of infrared light, explain how thunderstorms are formed and use infrared maps to predict severe weather.
Curated OER
Data, Data, Everywhere... and What Am I To Think?
Students demonstrate good random sampling techniques for data collection, select and develop graphic presentations of data and analyze the data to solve a problem presented.
Curated OER
Employee Payroll Simulation
Students simulate creating and calculating employees payrolls using hourly wages, deductions, and proper taxes.
Curated OER
Successful Interviewing
After performing a variety of pre-activities, students will complete steps that lead to a successful interview. Activities will include preparation for the interview, marketing oneself, follow-up and assessment. The students will...
Curated OER
Buying on Credit
Students determine how buying on credit adds to the total cost of an item by computing the interest. They find a major item advertised in a magazine and identify the price. Then they identify the rate of a credit card and calculate the...
Curated OER
Adding and Subtracting Polynomials Using Algebra Tiles
Students add and subtract polynomials. In this algebra lesson, students use algebra tiles to perform operation of polynomials. They model their problems and understand how to combine like terms using tiles.
Curated OER
Tangram Puzzles
Learners explore the origin of tangram. In this algebra lesson, students form different shapes and figures using tangram. They solve for the area of different shapes without using any geometric formulas, but the idea of tangram being put...
Curated OER
Picking Pythagoras
Students discover that side measurement is used in determining angle classification of a triangle. By squaring sides, they predict whether triangles be right, obtuse, or acute. They prove the Pythagorean Theorem and use it to solve...
Curated OER
Property: Ownership, Respect, and Responsibility
Students learn to respect others' property by rating the severity of a variety of damaging acts. Students use a tag board "thermometer" to rate the severity of statements describing situations where a person damages the property of another.


