HHS Math
Group Worksheet 1F - Graphing and Finding Zero
Graph quadratic functions and find the zero in this worksheet. Twelve problems range from those that could be quickly factored and graphed, to those that require use of the quadratic formula and their graphs approximated. Solutions...
West Contra Costa Unified School District
Investigating the Discriminant
When is finding the discriminant enough? Using the quadratic formula helps find solutions to quadratic equations, but there are times when just using the discriminant is appropriate. Use this algebra II instructional activity to help...
Curated OER
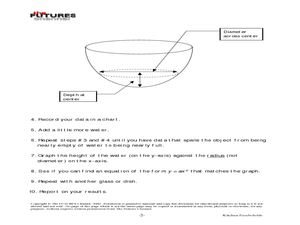
Kitchen Paraboloids
Young scholars solve quadratic equations and identify functions. In this algebra lesson, students graph parabolas and identify properties describing the shape of the parabola. They find the vertex and rewrite the equation in standard form.
Curated OER
Factoring
High Schoolers engage in a study of quadratic functions and focus upon the finding of equivalence and its connection between functions. They also practice factoring using the FOIL method while manipulating the equation. The lesson also...
Curated OER
Beginning Modeling for Linear and Quadratic Data
Students create models to represent both linear and quadratic equations. In this algebra lesson, students collect data from the real world and analyze it. They graph and differentiate between the two types.
Curated OER
Leap Into Exponential Functions
Students use properties of exponents to solve equations. In this algebra instructional activity, students add, subtract, multiply and divide exponential functions. They graph and differentiate between exponential growth and decay.
EngageNY
Modeling with Polynomials—An Introduction (part 2)
Linear, quadratic, and now cubic functions can model real-life patterns. High schoolers create cubic regression equations to model different scenarios. They then use the regression equations to make predictions.
EngageNY
Modeling from a Sequence
Building upon previous knowledge of sequences, collaborative pairs analyze sequences to determine the type and to make predictions of future terms. The exercises build through arithmetic and geometric sequences before introducing...
EngageNY
Are All Parabolas Similar?
Congruence and similarity apply to functions as well as polygons. Learners examine the effects of transformations on the shape of parabolas. They determine the transformation(s) that produce similar and congruent functions.
PBL Pathways
Maximizing Movie Revenue
Can theaters increase profits by raising or lowering ticket prices? Using data from the National Association of Theater Owners, classes consider this question. The project-based learning activity includes both a profit and revenue...
Del Mar College
Quick Reference Card
A neat and organized formula handout makes the circle go round, doesn't it? Full of higher algebra topics, formulas and rules, graphs and definitions—there is a way to support everyone in Algebra II or Pre-Calculus.
Curated OER
Multiplying Monomials
Students differentiate between linear and quadratic functions. In this algebra lesson, students write equations of graphs and graph a function from an equation. They also identify the slope and y-intercept.
Curated OER
Quadratic Modeling Of Canada's Baby Boom
Students model quadratic equations. In this algebra lesson, students are given data to graph using a function. They investigate vertex and transformation of quadratic functions.
Curated OER
Exploring Quadratic Graphs
Students solve quadratic equations using graphs. For this algebra lesson, students factor quadratic equations and graph their answer. They discuss the shape of their graph based on the function.
Curated OER
Iterating the Function over Real Numbers
Students use a spreadsheet to find sequences of numbers. In this algebra instructional activity, students find the values for c of a quadratic written in standard form. They relate the behavior of the graph to the values of the equation.
Curated OER
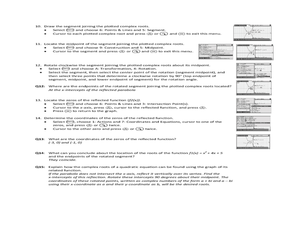
Complex Roots: A Graphical Solution
Using their Ti-Nspire to determine the solutions of parabolas, students explore the concept of complex roots. Students determine if parabolas have real or complex roots. Students determine the the axis of symmetry and the vertex given...
Curated OER
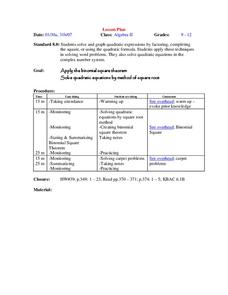
Quadratic Equations and Binomial Square Theorem
Learners factor quadratic equations. In this algebra lesson, students apply the binomial square theorem to solve quadratics. They complete the square and use the complex number system to solve for the roots.
Curated OER
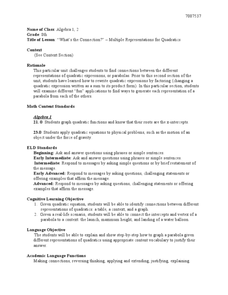
Representing Quadratics
Students represent quadratic equations using different methods. In this algebra lesson, students solve quadratics using substitution, elimination and graphing. They relate quadratics to the real world.
Curated OER
Quadratic Rules and Graphs
Students identify the properties of quadratic equations. In this algebra lesson, students find the vertex and intercepts of a parabola. They factor quadratics and identify the zeros of the equations.
Curated OER
Exploring Quadratic Graphs
In this algebra worksheet, students solve quadratic equations. They factor and graph their solutions. There are 5 questions with an answer key.
Curated OER
System of Two Quadratic Inequalities
Learners graph a quadratic inequality and describe its solution set. They solve a system of quadratic equalities graphically and symbolically and as related to a real-world context.
Curated OER
Academic Algebra II 1st Semester Exam
In the semester exam, students solve problems dealing the the discriminant of quadratic equations, systems of equations, linear equations and inequalities. Students also simplify radicals, complete squares, and find the inverse of a...
Curated OER
Linear and Nonlinear Functions
Pupils identify properties of a line. In this algebra lesson, students differentiate between functions and nonfunctions. They use the slope and y intercept to graph their lines.
Curated OER
Solving Quadratic Equations by Graphing
Learners solve quadratic equation by graphing. In this algebra lesson, students use the TI calculator to get a visual of their graph. They create a table of values, plot their points and graph the parabola.


