Curated OER
Modeling the Keeling Curve with Excel
In this modeling the Keeling Curve worksheet, students use given data beginning in 1960 to create a mathematical model for the changes in atmospheric carbon dioxide over time. Students manipulate the equation to predict the carbon...
Curated OER
Transformations and Exponential Functions
Tenth graders study graphing exponential functions. In this transformations lesson, 10th graders apply inquiry to determine how changes to a parent function affect its graph. Students analyze transformed graphs and generate the function...
University of North Texas
Math Exam 1 Review
Perfect as a review guide, this worksheet provides a range of questions focusing on functions. Topics include composing functions, transformations, domains, and polynomials. Also included are corresponding worksheets focusing on other...
Curated OER
Algebra II: Quadratic Functions
Students collect and organize data, make a scatterplot, fit a curve to the appropriate parent function, and interpret the results. Students translate among the various representations of the quadratic function, formulate equations, use a...
Curated OER
Thinking Outside the Box
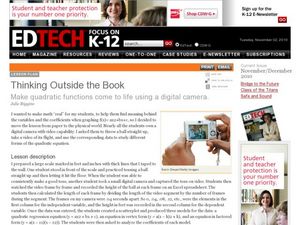
Now this instructional activity sounds fun! High schoolers throw a ball, film it as it soars through the air, and use a spreadsheet to collect data. A scatterplot is created to produce a quadratic regression equation, an equation in...
Curated OER
Model Data with Quadratic Functions
Young scholars model data using quadratic equations. In this algebra lesson plan, students simplify and factor quadratic equations. They graph the function using collected data and analyze the parabola.
Curated OER
The Kangaroo Conundrum: A Study of a Quadratic Function
Students play a game and collect data for their graph. In this algebra lesson, students solve quadratic equations and identify properties of their graph. They describe the pattern created by the graph and the game.
Curated OER
A Study of a Quadratic Function
Students factor and solve quadratic equations. In this algebra lesson, students play a game as the collect and graph data. they identify properties of their parabola and make predictions.
Inside Mathematics
Graphs (2004)
Show your pupils that perimeter is linear and area is quadratic in nature with a short assessment task that requests learners to connect the graph and equation to a description about perimeter or area. Scholars then provide a...
Curated OER
Completing the Square
Solve equations by completing the square. The pupils factor quadratic equations and graph the parabola. They also identify the different terms in the equation and look for patterns.
Curated OER
Real-World Linear Programming
Explore linear programming on a website game. Partners solve a real-world problem by setting up an objective function and a linear inequality. They graph their results on chart paper and also using a calculator before presenting their...
Curated OER
Rumors
Your young gossipers write an exponential function for the number of people who have heard a rumor after a number of days have passed. Learners then answer a series of questions, including whether or not the solutions are realistic by...
Curated OER
Quadratics: Polynomial Form
Students determine how changes in the coefficients in a quadratic function affect its graph. They determine how to use the equation to determine the intercepts of a quadratic function. Students identify the location of the intercepts...
EngageNY
Analyzing a Graph
Collaborative groups utilize their knowledge of parent functions and transformations to determine the equations associated with graphs. The graph is then related to the scenario it represents.
Rice University
Intermediate Algebra
Algebra concepts are all wrapped up in one nice bow. The resource combines all the concepts typically found in Algebra I and Algebra II courses in one eBook. The topics covered begin with solving linear equations and move to linear...
Rice University
College Algebra
Is there more to college algebra than this? Even though the eBook is designed for a college algebra course, there are several topics that align to Algebra II or Pre-calculus courses. Topics begin with linear equation and inequalities,...
PBL Pathways
Students and Teachers 2
Examine trends in student-to-teacher ratios over time. Building from the first task in the two-part series, classes now explore the pattern of student-to-teacher ratios using a non-linear function. After trying to connect the pattern to...
Virginia Department of Education
Square Patios
Build a patio from toothpicks and marshmallows to analyze functions! Learners look for patterns in the data as they create different size patios. As they discover patterns, they make connections between the different representations of...
Achieve
Ivy Smith Grows Up
Babies grow at an incredible rate! Demonstrate how to model growth using a linear function. Learners build the function from two data points, and then use the function to make predictions.
Illustrative Mathematics
Modeling London's Population
Looking at London's population from 1801–1961 in 20 year increments, high school mathematicians determine if the data can be modeled by a given logistic growth equation. They explain their thinking and determine the values of each...
Curated OER
Logarithmic Functions
Learners explore the characteristics of logarithmic functions and their relationship to exponential functions. Using the subscriber website Explorelearning.com, pupils observe changes in the input variable and its effect on the graph of...
Curated OER
Introduction to Solving Quadratic Equations by Factoring
Students solve quadratic equations. In this algebra lesson, students factor and graph linear and quadratic functions. They identify the standard and linear form of each equation.
Curated OER
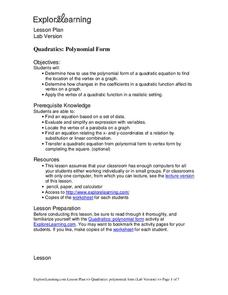
Quadratics: Polynomial Form
Students determine how to use the polynomial form of a quadratic equation to find the location of the vertex on a graph. They determine how changes in the coefficients in a quadratic function affect its vertex on a graph. Students find...
Curated OER
Ball Toss Activity
Pupils collect data from tossing a ball into the air. Using a data collection device, they graph the data, set a window, and analyze the height of the toss, how long the ball was in the air, etc. They then find an equation that models...


