Curated OER
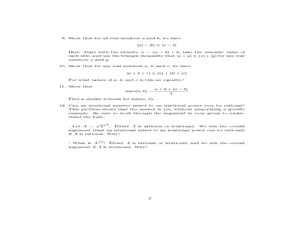
Math 32 Worksheet: Quadratic Equations
In this quadratic equations learning exercise, students solve 12 short-answer problems. Students find real and irrational solutions to given functions. Students raise irrational numbers to irrational powers.
Curated OER
Easy Worksheet: Graph Using Transformations
In this graph using transformations worksheets, students solve 4 graphing problems. Students graph each transformation given an equation in vertex form.
Curated OER
Solving Nonlinear Systems of Equations
In this system of equations worksheet, young scholars solve nonlinear systems of equations using the substitution method. An example of how to solve is given prior to the assignment. Twenty problems are available on this two-page worksheet.
Illustrative Mathematics
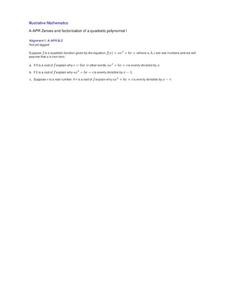
Zeroes and factorization of a quadratic polynomial I
This activity uses the division algorithm and the definition of a zero/root of a function to guide your class to see the relationship between zeros and factors of a general quadratic, which can later be generalized to the Remainder...
Curated OER
Functions and Their Graphs
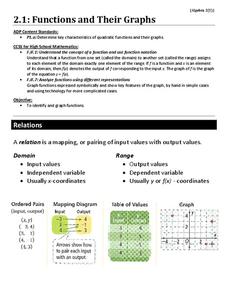
Use a learning exercise to go over the basic concepts of relations and functions. Included are clear definitions and examples of relations, domain and range, and functions and the vertical line test. However, the problems are...
Curated OER
SkyHighScrapers
Learners investigate quadratic functions. In this Algebra I/Algebra II lesson, students determine the equation of a quadratic function that closely matches a set of points. Learners investigate the necessary information that...
Curated OER
Telescope #2
Students investigate parabolas as the shape of a telescopic lens. In this Algebra I/Algebra II lesson, students explore the relationship between the coefficients of a quadratic function and the shape and position of the parabolic...
Curated OER
Sums and Difference of Cubes
Learners factor polynomials using the sum and difference of cubes. They also learn connections between the graph and expression.
Illustrative Mathematics
Throwing Baseballs
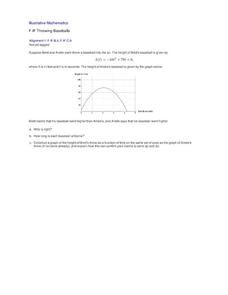
This is a wonderful exercise for learners to apply their critical thinking skills along with their knowledge of quadratic functions and parabolas. Young mathematicians investigate a real-world scenario about the height a baseball reaches...
Curated OER
Find Parabolas through Two Points
Your learners will write quadratic functions whose graphs include specific points and explore how these graphs are related to each other.
HHS Math
Group Worksheet 1F - Graphing and Finding Zero
Graph quadratic functions and find the zero in this worksheet. Twelve problems range from those that could be quickly factored and graphed, to those that require use of the quadratic formula and their graphs approximated. Solutions...
Mathematics Assessment Project
College and Career Readiness Mathematics Test A1
A six-page test covers content from several different high school math courses. It incorporates a few short answer, graphing, and word problems. It also allows room for mathematical reasoning and analysis.
Curated OER
Graphs and Equations
In this graphs and equations worksheet, students solve and complete 5 various types of problems. First, they complete a table of values for a given quadratic function. Then, students use the graph to find an estimate for the solutions of...
Desmos
Desmos Graphing Calculator
They say a graph is worth a thousand points. The interactive allows users to graph a wide variety of functions and equations. Using the included keyboard or typing directly into the list, learners determine the graph of a function....
CCSS Math Activities
Smarter Balanced Sample Items: High School Math – Target E
Pupils rewrite expressions in equivalent forms to identify key features. They use the vertex and factored forms of quadratic expressions to identify the extrema and intercepts. To finish the installment of the Claim 1 Item Slide Show...
EngageNY
Linear Systems in Three Variables
Put all that algebra learning to use! Using algebraic strategies, learners solve three-variable systems. They then use the three-variable systems to write a quadratic equation given three points on the parabola.
Balanced Assessment
Transformation II
Develop a solid understanding of the manipulation of expressions to produce equivalent expressions. Given an expression, pupils rearrange it to create a new one. Their new functions must match the structure of the model expressions.
West Contra Costa Unified School District
Polynomial Division
How do you apply the traditional division algorithm to polynomials? Here is an Algebra II lesson plan that extends the use of the division algorithm to polynomials. After establishing the concept of long division, synthetic division and...
Curated OER
Piecewise Modeling with Multiple Functions: Federal Debt
Students analyze data on debt and write an equation. In this statistics lesson, students are given data from different time periods, and are asked to graph and analyze the data. They work in groups, and are assigned different parts of...
Curated OER
Factoring
High Schoolers engage in a study of quadratic functions and focus upon the finding of equivalence and its connection between functions. They also practice factoring using the FOIL method while manipulating the equation. The instructional...
Illustrative Mathematics
Zeroes and factorization of a non polynomial function
Functions behaving badly: the squaring function and the absolute value function are both zero at x=0. Yet when you divide each by x, different things happen. Here, your class will explore each scenario as a means to adding depth to their...
Curated OER
Reflections of a Quadratic Function
Young scholars compare transformations of a quadratic function on a graph and determine equations of a quadratic functions based on a reflection. They graph a transformation of a function based on reflections. They etermine if a function...
EngageNY
Completing the Square (part 1)
Avoid the trap of memorizing steps when completing the square with a resources that provides a conceptual approach to completing the square. Learners that are able to recognize a perfect square trinomial are ready to complete the...
Curated OER
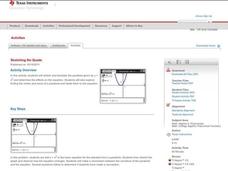
Stretching the Quads
Scholars investigate transforming parabolas. In this transforming parabolas lesson, they take the parent graph y=x^2 and transform it by shifting left, right, up, and down and shrinking and stretching. The class finds maximums,...


