EngageNY
Describing Center, Variability, and Shape of a Data Distribution from a Graphical Representation
What is the typical length of a yellow perch? Pupils analyze a histogram of lengths for a sample of yellow perch from the Great Lakes. They determine which measures of center and variability are best to use based upon the shape of the...
Lake Science Collaborative
Blood Circulation Simulation
Act out the circulation of blood in the body with an innovative activity. Kids act as either body parts or blood, and carry necessary nutrients and waste throughout different stations to represent the way that oxygen circulates.
American Physiological Society
Drug the Water Flea
This is a flea. This is a flea on drugs. Any questions? Your class will have questions aplenty during an impactful experiment. Lab groups get to know Daphnia magna, the humble water flea, and study the effects of stimulants and...
American Physiological Society
Sticky Adaptations A Lesson on Natural Selection
Now you see it, now you don't! The stick bug exhibits the ability to disappear into a wooded environment. Why does this adaptation manifest in some species, but not in others? Life science young scholars explore animal adaptations in...
EngageNY
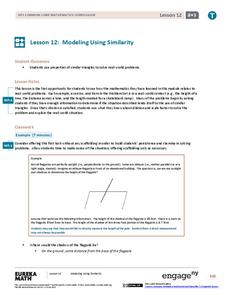
Modeling Using Similarity
How do you find the lengths of items that cannot be directly measured? The 13th installment in a series of 16 has pupils use the similarity content learned in an earlier resource to solve real-world problems. Class members determine...
Other popular searches
- Great Lakes Worksheet
- Great Lakes Biodiversity
- Great Lakes Map
- Label the Great Lakes
- Maps of Great Lakes
- The Great Lakes
- Michigan's Great Lakes
- Five Great Lakes
- Great Lakes Region
- Great Lakes Lesson Plans
- Traveling the Great Lakes
- Activities the Great Lakes


