Intel
Choreographing Math
Leaners investigate families of linear functions through dance. They choreograph dance moves to model nine unique linear functions of their choosing. Using their dance moves, teams create a video presentation complete with music and...
PBL Pathways
College Costs
Predict the year that college costs will double in your state using linear modeling. The first part of this two-part project based learning activity asks young mathematicians to use data from the College Board. They graph the data,...
PBL Pathways
Students and Teachers 2
Examine trends in student-to-teacher ratios over time. Building from the first task in the two-part series, classes now explore the pattern of student-to-teacher ratios using a non-linear function. After trying to connect the pattern to...
Howard County Schools
Planning for Prom
Make the most of your prom—with math! Pupils write and use a quadratic model to determine the optimal price of prom tickets. After determining the costs associated with the event, learners use a graph to analyze the break even point(s).
Intel
Pedal Power
Show your classes the importance of mathematics in something as simple as bicycle design. The final lesson in the six-part STEM series has each group research a different aspect of the bicycle. Learners use mathematical formulas, linear...
Curated OER
Roman Bernardo: Solving Linear Equations
Mathematicians use an inquiry method to solve linear equations. In this linear equations instructional activity, students practice solving equations using addition, subtraction, multiplication and division. They solve multi-step...
Curated OER
Graphing at all Levels: It's a Beautiful Thing!
Mixing math and art is done in this lesson by applying graphing knowledge to create a unique piece of art. This lesson varies acording to the graphing knowledge of the artist. First, learners identify and review various types of graphing...
Mascil Project
Closed Greenhouses
Controlling the efficiency of a greenhouse is a mathematical task. A collaborative project challenges learners to create an efficiency plan for a closed greenhouse. Using algebraic equations, they consider a set of constraints, design...
Howard County Schools
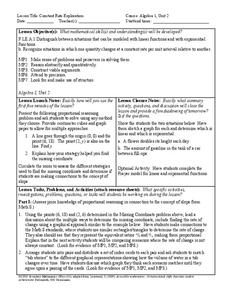
Constant Rate Exploration
Question: What do rectangles and bathtub volume have in common? Answer: Linear equations. Learn how to identify situations that have constant rates by examining two different situations, one proportional and one not proportional.
PBL Pathways
Medical Insurance 3
Create a technical report explaining the components of a medical plan through a function. The project-based learning activity gives a medical insurance scenario that young mathematicians model using piecewise functions. Their analyses...
PBL Pathways
College Costs 2
What is the financial benefit for attending a community college for the first two years before transferring to a four-year college? The second part of the educational lesson asks young scholars to explore this question through data...
PBL Pathways
Doctors and Nurses
How many nurses does it take to support one doctor? A project-based activity asks learners to analyze state data to answer this question. Classes create polynomial functions from the data of doctors and nurses over a seven-year...
PBL Pathways
Boogie Boards
Solve a complex business puzzle by building a linear programming model. An engaging project-based learning problem has classes examining transportation costs and manufacturing limitations from several plants. Ultimately, they use their...
PBL Pathways
Medical Insurance 2
Make an informed decision when choosing a medical insurance provider. An engaging lesson asks your classes to write piecewise models to represent the cost of different medical plans. The project-based learning activity is a variation of...
Ms. Amber Nakamura's Mathematics Website
Algebra Project
What would your dream house look like? A cottage? A medieval castle? High schoolers enrolled in Algebra design the perfect house while using slopes to write equations for various aspects of the project.
Achieve
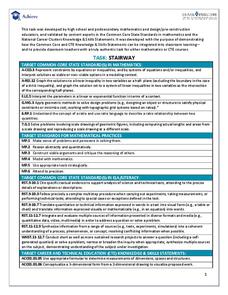
Stairway
It's the stairway to learning! Scholars research all aspects of building a staircase. Using information from building codes, they write and graph a system of inequalities to analyze the constraints. The completed project is a scale model...
Curated OER
Is there Treasure in Trash?
More people, more garbage! Young environmentalists graph population growth against the amount of garbage generated per year and find a linear model that best fits the data. This is an older resource that could benefit from more recent...
Curated OER
Dental Impressions
What an impressive task it is to make dental impressions! Pupils learn how dentists use proportional reasoning, unit conversions, and systems of equations to estimate the materials needed to make stone models of dental impressions....
Kenan Fellows
How Does an Unhealthy Diet Influence our Health and Well-Being?
You are what you eat, or so they say! After surveying family and friends on a week of eating habits, learners analyze the data for patterns. They compare different variables such as fats and cost, fats and calories, or fats and LDLs.
Curated OER
Slip Slide'n Away
Students analyze the sliding of boxes along a warehouse floor. In this algebra lesson, students connect math and physics by calculating the friction created by the sliding of each box. They develop faster method to move the box, based on...
Alabama Learning Exchange
The State Capital of Stem and Leaf
Students explore the concept of stem and leaf plots. In this stem and leaf plots lesson, students plot the 50 US states' capitals on a stem and leaf plot according to the first letter of each state. Students compare...


