Curated OER
Using Graphical Displays to Depict Health Trends in America's Youth
Identify the different types of graphs and when they are used. Learners will research a specific health issue facing teens today. They then develop a survey, collect and analyze data and present their findings in class. This is a...
Curated OER
Drive the Data Derby
Three days of race car design and driving through the classroom while guessing probability could be a third graders dream. Learn to record car speed, distances traveled, and statistics by using calculation ranges using the mean, median,...
Curated OER
The Power of Graphical Display: How to Use Graphs to Justify a Position, Prove a Point, or Mislead the Viewer
Analyze different types of graphs with learners. They conduct a survey and determine the mean, median and mode. They then identify different techniques for collecting data.
Curated OER
What's the Fizz Factor
Young scholars as a class create a fountain using both coke soda, and mentos candy. In this science lesson plan, students test which combination of coke and mentos products produce the tallest fountain. Young scholars use the scientific...
Curated OER
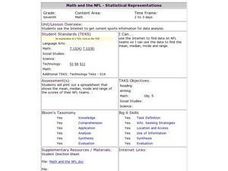
Math and the NFL - Statistical Representations
Seventh graders use the Internet to get current sports information for data analysis. They use their data to find the mean, median, mode and range. Students then place their data on a spreadsheet.
Curated OER
High School Mathematics Problems from Alaska: Fire Fighting Crew
Students apply mean, median and mode calculations of firefighter test scores to decide on hiring.
Curated OER
Beary O'Mometer Learns About Careers In Meteorology
Students explore the field of meteorology. In this meteorology lesson plan, students explore weather-related careers as they research the field of study as well as various weather concepts. Students interview meteorologists, write...
Curated OER
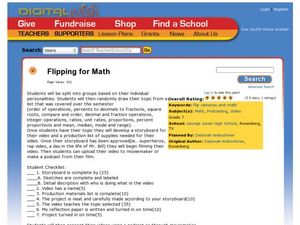
Flipping For Math
Seventh graders create a video of different formats to deliver a presentation of a math concept such as square roots, decimals, fractions, and more. In this math presentation lesson plan, 7th graders can plan a rap video, story,...
Curated OER
Statistics Newscast in Math Class
Students study sports teams, gather data about the teams, and create a newscast about their data. In this sports analysis lesson, students research two teams and define their statistical data. Students compare the two teams, make...
Curated OER
Macbeth Madness
Students research Macbeth online and complete computer and graphing activities for the play. In this Macbeth activities instructional activity, students research Macbeth and bookmark the URL's. Students complete activities for the topic...
Curated OER
What I Didn't Know...
Students practice creating wikis. In this wiki instructional activity, students create a wiki about any math topic that they know nothing about. Students learn about their topic and create a wiki that explains the math topic in detail.
Curated OER
America's Pastime
Students relate Newton's Laws of Motion to the game of baseball. They compare and contrast the materials used in baseballs that could affect their performance. They also determine how friction can be increased or decreased in a ballpark.
Curated OER
Bias in Statistics
Students work to develop surveys and collect data. They display the data using circle graphs, histograms, box and whisker plots, and scatter plots. Students use multimedia tools to develop a visual presentation to display their data.
Curated OER
Flying High in Math
Seventh graders study how real airplanes fly and then they construct models of paper airplanes using design resources for the Internet and their own design. They use meaurement and caluculations in order to help them construct their...


