Curated OER
Candy Bar Measurements
Geometers explore mathematics by completing an object measurement worksheet. They utilize a variety of candy bars and rulers to conduct a measurement experiment in class. They complete worksheets as a group based on the measurement...
Curated OER
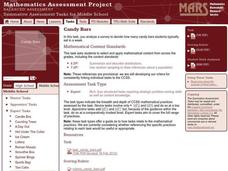
Candy Bars
There is often more to data than meets the eye. Scholars learn that they need to analyze data before making conclusions as they look at data that describes the number of candy bars boys and girls eat. They disprove a given conclusion and...
Curated OER
Favorite Candy Bar Graph
Students decide on six different types of candy bars to include in a data collection activity. Working in small groups, they survey a target group in a set amount of time. They access a Internet based graphing tool to create a bar graph...
Curated OER
Counting Candies
Students count, sort, and classify jellybeans by color. They use their data to create a bar graph. Students are given a small bag of jellybeans, and a worksheet on Counting Candies Tally Chart. They work in small groups. Students are...
Curated OER
The Geology of a Snicker’s Bar: Tectonic Plates
Students explore the layers of the Earth using a Snicker's bar. In this science lesson, students identify the parts of the Snicker's bar and identify which layer of the Earth the parts of the candy bar would represent. Students discuss...
Curated OER
The Candy Color Caper
Students explore the concept of probability. They calculate the probability of an event happening and graph their results. Students determine the probability of winning a sweepstakes. They construct a bar graph to represent all the...
Curated OER
Candy Bar Subsurface Geology
High schoolers are introduced to drawing and interpreting topographical maps. They each cut through there Jell-o mountain at regular height intervals, and trace around the shape of the Jell-o cut off at the height, overlaying the...
Curated OER
Build A Skittles Graph
Students explore graphing. In this graphing lesson, students sort Skittles candies and use the color groups to create a bar graph. Rubrics and extension activities are provided.
Curated OER
Probability Using M&M's
Students estimate and then count the number of each color of M&M's in their bag. In this mathematics lesson, students find the experimental probability of selecting each color from the bag. Students create pictographs and bar graphs...
Curated OER
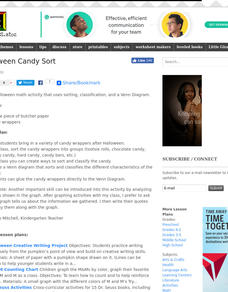
Halloween Candy Sort
Learners use their Halloween candy to practice sorting and classifying. They compete a Venn diagram comparing their candy wrappers. They develop ways as a class to catorgize the candy in different ways.
Curated OER
Candy is Dandy
Students investigate color distribution in bags of M&Ms They sort and classify the contents of a bag of M&Ms and summarize their findings on a worksheet. Students convert the numbers into charts and make predictions about color...
Curated OER
The True Value of Sweets
Measure your pupil's learning in a lesson designed to explore decimals by weighing different candies on a scale and recording the weight. Small groups then compare and order the decimal weights on a number line to show their...
Curated OER
Breaking Things on Purpose
Pupils predict the required stress to break a candy bar. They examine how a various substances break and infer a cause for the type of break.
Students relate the candy bar experiment to the importance of nanotech laboratory work and how...
Curated OER
Physical Changes and States of Matter - Two
Here's a wonderful lesson on how substances change states. Groups of learners are given trays with a chocolate bar, a piece of paper, an ice cube, and a balloon. During the activity, the groups closely observe the changes that each...
Curated OER
What's in a Graph?
How many yellow Skittles® come in a fun-size package? Use candy color data to construct a bar graph and a pie chart. Pupils analyze bar graphs of real-life data on the Texas and Massachusetts populations. As an assessment at the end of...
Curated OER
Candy Quakes
Eighth graders use candy to show the effects of deformation forces on the earth's crust. In this rock and fossil formation instructional activity students construct models and simulations to describe and explain natural phenomena.
Curated OER
Surveying During a Basketball Game
Tenth graders conduct a survey at a high school basketball game. They compile and present the data as histograms or bar graphs.
Curated OER
If You Bit A Rock
Students describe the physical characteristics of a familiar model and apply it to an unfamiliar one. In this investigative lesson students become familiar with rock characteristics by participating in a candy bar activity.
Curated OER
Sweet Data
Students input data about the colors of their serving of M&M candies onto a spreadsheet. They create charts and graphs based on this information.
Curated OER
Probability or Ability?
Pupils use their non-dominant hand to catch candy which they tossed in the air. They estimate how many they catch in a second round. They record and determine how the probability changed the second time.
Curated OER
Build a Skittles Graph
Learners construct a bar graph with a given set of data. They calculate the ratio and percent of the data. Students discuss alternate ways of graphing the data as well as multiple strategies to approach the task.
US Department of Agriculture
Serving Up My Plate
Within three nutrition-themed, inquiry-based learning opportunities, pupils take notice of their eating habits; delve deep into the five food groups, gain experience in planning meals, participate in a taste test, and explore ads from...
Curated OER
Mechanical Properties of Chocolate: How Hard is your Chocolate?
Students calculate, measure and identify the hardness of various chocolate bars. They determine the hardness of the chocolate bar using quantitative data. Students make observations of the hardness of chocolate while dropping the...
Curated OER
Bite Sized Core Sampling
Young scholars define the origin of rock samples and how surface core samples can tell us about the history and make-up of Mars. Candies are used as a Martian surface sample. Students study the samples and make a hypothesis about the...
Other popular searches
- Candy Bar Poem
- Candy Bar Math
- Candy Bar Fractions
- Candy Bar Nutrition Label
- Rock Candy Bar Graph
- Candy Bar Economics
- Mars Candy Bar
- Candy Bar Poll
- Candy Bar Life
- Candy Bar Lesson
- Candy Bar Graphs
- Candy Bar Graphing


