Curated OER
Candy Bar Measurements
Geometers explore mathematics by completing an object measurement worksheet. They utilize a variety of candy bars and rulers to conduct a measurement experiment in class. They complete worksheets as a group based on the measurement...
Curated OER
The Geology of a Snicker’s Bar: Tectonic Plates
Students explore the layers of the Earth using a Snicker's bar. In this science lesson, students identify the parts of the Snicker's bar and identify which layer of the Earth the parts of the candy bar would represent. Students discuss...
Curated OER
Counting Candies
Students count, sort, and classify jellybeans by color. They use their data to create a bar graph. Students are given a small bag of jellybeans, and a worksheet on Counting Candies Tally Chart. They work in small groups. Students are...
Curated OER
The Candy Color Caper
Students explore the concept of probability. They calculate the probability of an event happening and graph their results. Students determine the probability of winning a sweepstakes. They construct a bar graph to represent all the...
Curated OER
Build A Skittles Graph
Students explore graphing. In this graphing lesson, students sort Skittles candies and use the color groups to create a bar graph. Rubrics and extension activities are provided.
Curated OER
Probability Using M&M's
Students estimate and then count the number of each color of M&M's in their bag. In this mathematics lesson, students find the experimental probability of selecting each color from the bag. Students create pictographs and bar graphs...
Curated OER
The Peanut Wizard
Students read and discuss information regarding George Washington Carver and how the peanut became cultivated in the southern colonies of the United States. In this George Washington Carver lesson, students develop vocabulary that...
Curated OER
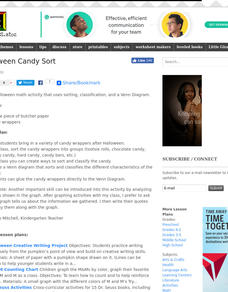
Halloween Candy Sort
Learners use their Halloween candy to practice sorting and classifying. They compete a Venn diagram comparing their candy wrappers. They develop ways as a class to catorgize the candy in different ways.
Curated OER
Candy is Dandy
Students investigate color distribution in bags of M&Ms They sort and classify the contents of a bag of M&Ms and summarize their findings on a worksheet. Students convert the numbers into charts and make predictions about color...
Curated OER
Physical Changes and States of Matter - Two
Here's a wonderful lesson on how substances change states. Groups of learners are given trays with a chocolate bar, a piece of paper, an ice cube, and a balloon. During the activity, the groups closely observe the changes that each...
Curated OER
Seed Swapping
Here is a fabulous, cross-curicular lesson on seeds. Elements of science, writing, math, agricultural practices, and art are all brought into this incredibly thorough plan. Additionally, a fun whole-class game is presented, and there is...
Curated OER
Sensational Soil
Fourth and fifth graders explore soil by taking a simulated field trip under the earth. They go to an Internet site that runs a simulation which charges them with finding a source of pollution that could destroy all of Earth's soil, and...
Curated OER
What's in a Graph?
How many yellow Skittles® come in a fun-size package? Use candy color data to construct a bar graph and a pie chart. Pupils analyze bar graphs of real-life data on the Texas and Massachusetts populations. As an assessment at the end of...
Curated OER
The True Value of Sweets
Measure your pupil's learning in a lesson designed to explore decimals by weighing different candies on a scale and recording the weight. Small groups then compare and order the decimal weights on a number line to show their...
US Department of Agriculture
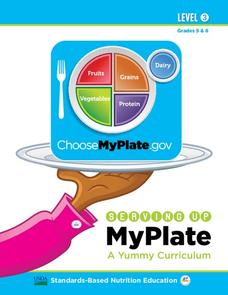
Serving Up My Plate
Within three nutrition-themed, inquiry-based learning opportunities, pupils take notice of their eating habits; delve deep into the five food groups, gain experience in planning meals, participate in a taste test, and explore ads from...
Curated OER
Candy Quakes
Eighth graders use candy to show the effects of deformation forces on the earth's crust. In this rock and fossil formation instructional activity students construct models and simulations to describe and explain natural phenomena.
Curated OER
If You Bit A Rock
Students describe the physical characteristics of a familiar model and apply it to an unfamiliar one. In this investigative lesson students become familiar with rock characteristics by participating in a candy bar activity.
Curated OER
Sports Helmets and Impact Testing of Polymers
Students examine the importance of good quality safety gear. In this investigative lesson plan, students will tests various polymers, collect data, and analyze the data to determine which polymer is best for safety helmets. They will...
Curated OER
Gingerbread Spacecraft
Students explore the different parts of the Cassini spacecraft. For this space science lesson, students create a model of the spacecraft using food products. They compare and contrast their model with the real one and evaluate its...
Curated OER
Penny
Students explore the concept of equivalency. In this equivalents lesson, students use pennies to show equivalency as they divide them into groups. Students also convert the pencils into decimals and fractions.
Curated OER
Using Fractions to Represent M&M Colors
Students investigate the concept of fraction and tangible application. In this algebra instructional activity, students use fractions to solve real life scenarios. They convert between fractions and decimals and identify the numerator...
Curated OER
Statistics of Mars
Students explore the concept of central tendencies. In this central tendencies lesson, students sort M&M's or Skittles based on color. Students graph their results. Students find the mean, median, and mode of their data.
Curated OER
Sweet Data
Students input data about the colors of their serving of M&M candies onto a spreadsheet. They create charts and graphs based on this information.
Curated OER
Probability or Ability?
Pupils use their non-dominant hand to catch candy which they tossed in the air. They estimate how many they catch in a second round. They record and determine how the probability changed the second time.


