Mathematics Assessment Project
Designing 3d Products: Candy Cartons
Wouldn't it be great to work in a candy factory? Learners get their chance as they first design a carton for a candy that meets certain requirements. They then examine and analyze nets and explanations in sample student responses.
Curated OER
Candy Bar Measurements
Geometers explore mathematics by completing an object measurement worksheet. They utilize a variety of candy bars and rulers to conduct a measurement experiment in class. They complete worksheets as a group based on the measurement...
American Statistical Association
A Sweet Task
Candy is always an effective motivator! A fun math activity uses M&M's and Skittles to explore two-way frequency tables and conditional probability. The candy can serve a dual purpose as manipulatives and experimental data.
Curated OER
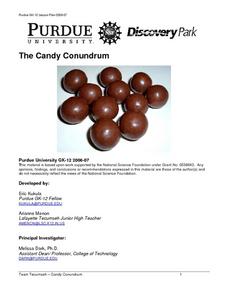
The Candy Conundrum
Students design a candy container that contains a specific amount of candy. They demonstrate how an engineering problem can be solved with math and that there are multiple answers to the problem. They compute volume of spheres.
Stats Monkey
Everything I Ever Needed to Learn about AP Statistics I Learned from a Bag of M and M's®
Candy is always a good motivator! Use this collection of M&M's® experiments to introduce statistics topics, including mean, standard deviation, nonlinear transformation, and many more. The use of a hands-on model with these AP...
Curated OER
Yummy Math
Young mathematicians use bags of Skittles to help them gain practice in graphing and organizing data. They work in pairs, and after they have counted and organized their Skittles, they access a computer program which allows them to print...
Curated OER
The Candy Color Caper
Students explore the concept of probability. They calculate the probability of an event happening and graph their results. Students determine the probability of winning a sweepstakes. They construct a bar graph to represent all the...
Virginia Department of Education
Graphing Linear Equations
Combine linear equations and a little creativity to produce a work of art. Math scholars create a design as they graph a list of linear equations. Their project results in a stained glass window pattern that they color.
Curated OER
M&M Math
Students research number values by participating in a candy exercise. In this math function lesson, students utilize baking ingredients to create cookies and multiply how many M&M's will go into the batch if you want a certain amount...
Curated OER
Survival of the Fittest -- Battling Beetles
Students experiment with traits. In this Science lesson, students test the strength of beetles using M&M candies in lieu of the insects. Students use the Hardy-Weinberg Equation to calculate possible offspring traits of further...
Curated OER
Halloween Candy Sort
Learners use their Halloween candy to practice sorting and classifying. They compete a Venn diagram comparing their candy wrappers. They develop ways as a class to catorgize the candy in different ways.
Curated OER
Candy is Dandy
Students investigate color distribution in bags of M&Ms They sort and classify the contents of a bag of M&Ms and summarize their findings on a worksheet. Students convert the numbers into charts and make predictions about color...
Curated OER
Exponential Functions -- M&M Activity
Students receive cups and M & M candies. They perform an experiment to compare the graph of theoretical and experimental exponential growth. Students spill a pair of candies onto the table. They add candies for each "M" they see....
Curated OER
We All Scream for Ice Scream
High schoolers explore the formulas for volume of three-dimensional objects. They participate in various activities involving ice cream, ice cream cones, small candies, and gum balls, recording their calculations on a lab sheet.
Statistics Education Web
Population Parameter with M-and-M's
Manufacturers' claims may or may not be accurate, so proceed with caution. Here pupils use statistics to investigate the M&M's company's claim about the percentage of each color of candy in their packaging. Through the activity,...
Curated OER
What's in a Graph?
How many yellow Skittles® come in a fun-size package? Use candy color data to construct a bar graph and a pie chart. Pupils analyze bar graphs of real-life data on the Texas and Massachusetts populations. As an assessment at the end of...
Curated OER
Growing Rock Candy
Students observe the growth of rock candy. In this crystal growth lesson, students make rock candy and measure the crystal growth over five days.
Curated OER
Favorite Candy Bar Graph
Students decide on six different types of candy bars to include in a data collection activity. Working in small groups, they survey a target group in a set amount of time. They access a Internet based graphing tool to create a bar graph...
Curated OER
Volume & Candy Creations Model
Sixth graders investigate surface area. In this surface area lesson, 6th graders design a box of candy that has a volume of 30 cubic inches. Students are trying to minimize surface area while keeping volume constant. Students...
Curated OER
M & M Candy: I Want Green
Eighth graders use colored candy pieces (such as M & M's) to compare mathematical expectations and experimental probability. They pick pieces of candy randomly, and graph their results. This classic activity never fails to engage...
Curated OER
Statistics with M&Ms
Seventh graders explore estimation, measurement, and probability. Students conduct surveys and create charts & graphs. They study the history of chocolate. Students design their own magazine advertisement or create a script for a...
Curated OER
Sweet Data
Students input data about the colors of their serving of M&M candies onto a spreadsheet. They create charts and graphs based on this information.
Curated OER
Farmers Dilemma
Students investigate the "futures" market and how it affects farmers by completing a prediction activity utilizing bags of M&Ms. While completing this activity, students practice basic mathematics skills and reinforce economic terms.
Curated OER
Carbon Dating
Simulate C-14 decay using M&M and Reese's Pieces candies. In this scatter-plot lesson, students perform an experiment to simulate the half life of C-14. Information is plotted on a scatter-plot. Students answer four comprehension...


