Curated OER
Changing Planet: Permafrost Gas Leak
Pair earth scientists up to use an amazing online arctic portal mapping tool and Google Earth to analyze permafrost changes. They compare changes to data on atmospheric concentrations of methane to see if there is a correlation. Then...
Curated OER
GIS: Mapping Watersheds of the Edwards Aquifer in Travis County
Students manipulate existing GIS data to create and map a new layer of information that shows that watersheds in Travis County that are on top of Edwards Aquifer. They create and map that shows the watersheds in Travis County that are on...
Curated OER
Matrix Analysis of Networks
Explore the connection between a finite graph, a directed graph, and a matrix. Graph lines and identify the relationship of matrices in real-world scenarios. Then use this information to work with a partner to plan and design a...
Curated OER
TE Lesson: Habitat Mapping
Students examine the current technologies used in mapping resources in the marine environment. They look at remote sensing, sounding, and underwater vehicles. They examine image from the benthic habitat produced by the GIS in order to...
Curated OER
Fostering Geospatial Thinking: Space to Earth: Earth to Space (SEES)
Young scholars locate and access data to help them with their science inquiry. For this geographical positioning lesson students evaluate and compare data sets.
Association of American Geographers
Project GeoSTART
Investigate the fascinating, yet terrifying phenomenon of hurricanes from the safety of your classroom using this earth science unit. Focusing on developing young scientists' spacial thinking skills, these lessons engage...
Curated OER
Mapping Lab and Lead Poisoning
Students are introduced to GIS and its uses. They make predictions before viewing the actual lead poisoning cases by location of Dade County. Pupils use actual Miami-Dade County spatial data to explore basic principals. Students
Curated OER
Who's Range is it?
Students investigate the habits of panthers by analyzing radio transmitted data. In this animal life lesson, students utilize computers to view the range of different statistics dealing with Florida panthers. Students...
Curated OER
Fractile vs. Equal
Students compare and contrast methods of categorizing data. In this data collection lesson, students complete worksheet activities that require them to note the differences between equal and fractile intervals. Students also discuss...
Curated OER
Floodplains in the field (with GIS)
Students measure a topographic and geologic cross-section across a floodplain by simple surveying and auguring techniques. They consider the spatial context of the field observations, use GPS measurements, and desktop GIS analyses.
Curated OER
Teaching Modeling Water Quality
Students explore the basics of interpreting RUSS temperature and oxygen profile data. They are introduced to the Geographic Information Systems (GIS), particularly with respect to interpreting maps.
Curated OER
Hurricanes and Climate
Pupils investigate maps and data to learn about the connections between hurricanes and climate. In this exploratory activity students describe and graph the 6 regions where hurricanes happen and discuss how hurricanes have changed over...
Curated OER
Storm Clouds-- Fly over a Late Winter Storm onboard a NASA Earth Observing Satellite
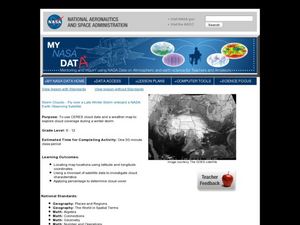
Students study cloud data and weather maps to explore cloud activity. For this cloud data lesson students locate latitude and longitude coordinates and determine cloud cover percentages.
Curated OER
The Great MPA Debate
Students study the 'Marine Protected Areas' process. In this ocean lesson plan students work in groups, conduct research and present it to the class.
Curated OER
How High Is That?
Students explore the National Spatial Reference System. In this vertical position lesson plan, students will discuss the use of vertical position data and solve practical problems involving geographic positioning.
Curated OER
Weather Pals
Students study maps of the United States to locate weather pals from a list of schools. They communicate with Weather Pal schools through the use of closed circuit TV. Using weather data collected in their area, they exchange the...
Curated OER
Show Me the Way To Go Home
Students place a pencil perpendicular to the ground and trace its shadow between 11:30 AM and 12:30 PM. They measure the length of the shadow, periodically over several hours, in either English or Metric units. Using the data, they find...
Curated OER
The Energy Debate - Sea Level Rise
Students comprehend the impact of global warming on our coastal cities. They appreciate how geographic information systems can be used to represent scientific data. Students research the melting of the ice caps in Antarctica and the Arctic.
Curated OER
Radiation Comparison Before and After 9-11
Using the NASA website, class members try to determine if changes could be detected in cloud cover, temperature, and/or radiation measurements due to the lack of contrails that resulted from the halt in air traffic after the attacks...
Curated OER
Mapping My Community
Ninth graders are introduced to GPS technology. They complete fieldwork as they visit a specific area of their community to identify and map types of land use in the surveyed area. They use the collected data to create a digital map.
Curated OER
When is Dinner Served? Predicting the Spring Phytoplankton Bloom in the Gulf of Maine (College Level)
Students are able to explain the ecological importance of phytoplankton. They describe the components that influence a phytoplankton bloom. Students interpret satellite images in order to correlate buoy data.
Curated OER
Rock Creek Water Quality
Ninth graders test water in a local creek using chemical kits and probes. They take GPS readings and digital photos. They calculate the Water Quality Index and create a spreadsheet of the test data.
Curated OER
Comparing Local, National, International Biomes
Students calculate averages of climate sets of data. In this ecology lesson, students analyze data to determine identity of a biome and collect meteorological data to understand process. Students also compare data sets.
Curated OER
What in Our World Affects the Way People Live
Sixth graders study various maps that show geographical features and population. They compare the maps and make inferences about how various geographical features influence the population and human activities of an area.


