Statistics Education Web
Population Parameter with M-and-M's
Manufacturers' claims may or may not be accurate, so proceed with caution. Here pupils use statistics to investigate the M&M's company's claim about the percentage of each color of candy in their packaging. Through the activity,...
Curated OER
Using Abiotic and Biotic Parameters to Monitor Air Quality
Students identify the abiotic factors that influence a river or stream and the organisms that live in it. They measure several abiotic and biotic parameters to gauge water quality. Students examine the biotic environment by identifying...
Shodor Education Foundation
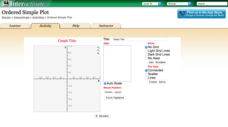
Ordered Simple Plot
Open your imagination to make algebra-inspired creations. An interactive lesson has scholars graph images from a set of parameters. Users can practice minimum values, maximum values, and scale as well as key features.
Curated OER
Correlation of Variables by Graphing
Middle and high schoolers use a spreadsheet to graph data. In this graphing instructional activity, learners determine how two parameters are correlated. They create a scatter plot graph using a computer spreadsheet.
Curated OER
Salmon in the Classroom
Students list the salmon life cycle stages in order. They draw a stream with the vegetation, animals, and water quality parameters that are necessary for salmon survival. Students explain the connection between animal morphology and...
Curated OER
Good Old Earth Materials
Students investigate different types of building structures and how they are able to stand up to earthquakes. Through comparison they determine which buildings are better able to handle earthquakes than others. They create a building,...
Curated OER
Families of Functions
Students investigate families of functions. In this families of functions lesson, students discuss how changing a functions parameters affect its' graph. Students vary slope and y-intercepts of linear functions. ...
Curated OER
Recyclers to the Rescue
Producers, consumers, food chains, and plants are the stars of this science lesson. Learners take part in an inquiry which helps them to discover the most effective and efficient way to grow a producer. They have a variety of containers...
Curated OER
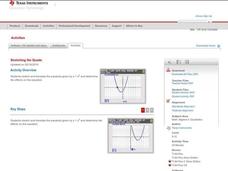
Stretching the Quads
Explore parabolas in this algebra lesson with the graphing calculator. The class investigates what effects the changing of the parameters of the vertex form of a quadrati have to its graph. They find the zeros of a quadratic graphically...
Polar Trec
Mini-Ocean Bathymetric Mapping Research Cruise
Middle or high schoolers transform into oceanographers in a week-long simulation. To begin, each group follows directions to create a model of the ocean floor with specified features. Next, the groups prepare to set sail on a research...
Curated OER
Evidence of Change Near the Arctic Circle
Students analyze graphs and make conclusions about climate change. In this climates lesson students produce graphs and identify relationships between parameters.
Curated OER
Effects of Parameter Changes
Students define properties of a quadratic equation. In this algebra lesson, students graph and factor quadratic functions. They write equations for polynomials, given a graph.
Curated OER
Bringing Climate Change Into the Classroom
Young scholars investigate the greenhouse effect and examine the potential effects of climate change in the Arctic. They construct a mini-greenhouse and test its effect on temperature, analyze historical climate statistics, and conduct...
Curated OER
De"compost"ition
Students develop an understanding of the decomposition process and the parameters which influence the rate at which it occurs.
California Academy of Science
Optimal and Sustainable: Renewable Energy Revamp
More than 100 cities around the world have shifted from fossil fuels to renewable energy sources. Scholars investigate a city wanting to make this switch, but needs help determining how to make the shift. Groups consider all options,...
Curated OER
Slider Template
Students identify parameters using a slider template. For this precalculus lesson, students relate a slider to a calculator. It provides the students the opportunity to control the perimeter of the equations.
Curated OER
Families of Functions
Learners use sliders to change the parameters of functions and examine how shifting parameters affects a graph. They identify the parameters of functions, find vertical and horizontal stretches, then calculate the scale factor and other...
Curated OER
Standard Form of Quadratic Functions
Students factor quadratic equations. In this algebra lesson, students identify the factors and use them to graph the parabola. They find the parameters and vertex of each graph.
Curated OER
Insect Monitoring
Students participate in an interactive lesson using the scientific method to study biodiversity. In this insect monitoring lesson, students simulate the layers of soil and the insects that would live there. Students design...
Curated OER
Educating K-12 Students about Glacier Dynamics in a Changing Climate
Students determine which of the following parameters, slope, ice, temperature or basal condition affects the glacier speed the most. They create their own experiment to test what influences glacier speed and temperature of the ice.
Curated OER
Establishing a Baseline Ecology of a Creek Ecosystem
High schoolers investigate the physical, chemical and biological parameters necessary to establish an ecological baseline. Establishing an ecological baseline not only shows the ecological characteristics of a creek but makes the...
Curated OER
Wrapping It All Up
Through learning how to examine linear, quadratic, and exponential functions, students explore the effects of changes in parameters on the graphs of linear, quadratic, and exponential functions. The activity is designed to be a...
Curated OER
Investigating Equations of Lines
High schoolers investigate linear equations as they use technology (Cabri, Jr.) to explore the equations of lines in slope-intercept form. The technology allows learners to manipulate the line and observe the changes in the parameters of...
Statistics Education Web
Who Sends the Most Text Messages?
The way you use statistics can tell different stories about the same set of data. Here, learners use sets of data to determine which person sends the most text messages. They use random sampling to collect their data and calculate a...
Other popular searches
- Changing Parameters
- Parameter Math
- Area and Parameter
- Parameterized
- Parameter Area Volume
- Parameter of the Equation
- Parameter Changes
- Parameters Dictionarycom
- Parameter Form Plane
- Parameter Algebra
- Parameters dictionary.com
- Parameter of Squares


