Curated OER
Investigating Equations of Lines
High schoolers investigate linear equations as they use technology (Cabri, Jr.) to explore the equations of lines in slope-intercept form. The technology allows learners to manipulate the line and observe the changes in the parameters of...
EngageNY
Vectors and the Equation of a Line
Represent linear equations in both two and three dimensions using parametric equations. Learners write parametric equations for linear equations in both two and three variables. They graph and convert the parametric equations to...
Curated OER
Graph Dynamic Linear Equations
Students explore the concept of linear equations. In this linear equation lesson plan, students change parameters of an equation and notice the effect it has on its graph.
Curated OER
Introduction to Parametric Equations
Students write and solve parametric equations. In this algebra lesson, students find and eliminate parameter of equations. They graph parametric equations and analyze the graphs.
Curated OER
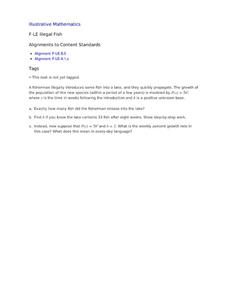
Illegal Fish
Your young fishermen learn about exponential function growth by interpreting the pieces of the given equation within the context of numbers of fish in a lake.
Curated OER
Effects of Parameter Changes
Students define properties of a quadratic equation. In this algebra lesson, students graph and factor quadratic functions. They write equations for polynomials, given a graph.
Curated OER
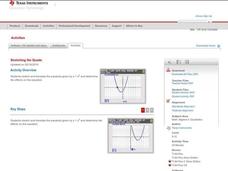
Stretching the Quads
Explore parabolas in this algebra lesson with the graphing calculator. The class investigates what effects the changing of the parameters of the vertex form of a quadrati have to its graph. They find the zeros of a quadratic graphically...
Curated OER
Affine Recurrence Plotter
Learners use the on-line affine recurrence plotter to graph equations. They work on-line to create graphs of trout in a trout pond and savings account balances when interest is compounded over time. Links to the four one-day lessons are...
Concord Consortium
Function Project
What if a coordinate plane becomes a slope-intercept plane? What does the graph of a linear function look like? Learners explore these questions by graphing the y-intercept of a linear equation as a function of its slope. The result is a...
Curated OER
Plugging Into The Best Price
Examine data and graph solutions on a coordinate plane with this algebra lesson. Young problem-solvers identify the effect of the slope on the steepness of the line. They use the TI to graph and analyze linear equations.
Curated OER
Graph Figures From Equations
Students explore the concept of graphing figures from equations. In this graphing lesson, students use Microsoft Math to graph figures from equations and write equations from graphed figures.
Curated OER
The Lift Equation
Learners use the FoilSim educational software program to complete an activity regarding lift. They solve a multivariable equation for each of the variables and apply the results to various problems in different situations.
Curated OER
Standard Form of Quadratic Functions
Students factor quadratic equations. For this algebra lesson, students identify the factors and use them to graph the parabola. They find the parameters and vertex of each graph.
Curated OER
Graphing the Absolute Vaule Function
Learners investigate the graph of the absolute value function and the relationship between the parameters of the equation and the graph of the function.
Curated OER
Correlation of Variables by Graphing
Middle and high schoolers use a spreadsheet to graph data. In this graphing lesson, learners determine how two parameters are correlated. They create a scatter plot graph using a computer spreadsheet.
Curated OER
Wrapping It All Up
Through learning how to examine linear, quadratic, and exponential functions, high schoolers explore the effects of changes in parameters on the graphs of linear, quadratic, and exponential functions. The lesson is designed to be a...
Curated OER
Zeros of a Quadratic Function
Factor quadratic equations by teaching your learners how to identify the zeros of the quadratic function. They use the TI to see where the graph will intercept the coordinate plane.
Curated OER
Application of Graph Theory
Students investigate different online tutorials as they study graphing. In this graphing lesson, students apply the concept of graphs cross curricular and use it to make predictions. They define the purpose and theories behind graphs.
EngageNY
Modeling with Polynomials—An Introduction (part 2)
Linear, quadratic, and now cubic functions can model real-life patterns. High schoolers create cubic regression equations to model different scenarios. They then use the regression equations to make predictions.
Teach Engineering
Discovering Relationships Between Side Length and Area
Consider the relationship between side length and area as an input-output function. Scholars create input-output tables for the area of squares to determine an equation in the first installment of a three-part unit. Ditto for the area of...
Curated OER
Follow That Graph
Learners investigate the graphs of six trigonometric functions. They discover how changes in the equation of the basic function affect the graph of the function.
Curated OER
Windsail Design
Students fit quadratic models to windsail designs. In this fitting quadratic models to windsail designs lesson, students compare quadratic models of sails with different measurements and mast size. Students vary the a-value...
Curated OER
Sinusoidal modelling of Canad'a youth cohorts
Learners explore the general form of the sine equation. In this trigonometry lesson, students explore the relationship between the changing parameters and the graph of the sine equation. Learners use data and a statistical...
Curated OER
Vertex and Factored Form of Quadratic Functions
High schoolers graph quadratic equations. In this algebra lesson, students solve quadratic equations by factoring. They identify the end behavior of the graph.


