Curated OER
Introduction to Representing and Analyzing Data
Represent data graphically. Allow your class to explore different methods of representing data. They create foldables, sing songs, and play a dice game to reinforce the measures of central tendency.
Curated OER
What Can Data Tell Us?
Young scholars explore data distribution. In this data analysis instructional activity, students create a data distribution table by playing the game "Tower of Hanoi" from the Hall of Science. Young scholars analyze their data and answer...
Curated OER
Penny Basketball: Making Sense of Data
Explore four web-based interactive sites to develop a baseline understanding of statistics. Learners play a series of penny basketball games and collect data regarding their shooting statistics. Groups decide who is the "top" penny...
Curated OER
Reformers versus Residents in Five Points: A Role Play
Social Studies and role-playing can go hand in hand. Learners use supporting evidence found in primary and secondary source material to develop a character from the Five Points neighborhood in the 1850s. Each student takes on the role of...
CK-12 Foundation
Line Graphs to Display Data Over Time: Strawberry Competition
Take the tediousness out of graphing. Using the interactive tool, learners can efficiently create a line graph from a set of data. They then use the graph to answer questions about specific trends in the data.
Curated OER
Play It
There are a number of activities here that look at representing data in different ways. One activity, has young data analysts conduct a class survey regarding a new radio station, summarize a data set, and use central tendencies to...
Curated OER
What's Playing Tonight?
Students collect data and visually represent it. They conduct a survey of favorite movies. Using a spreadsheet, students organize the data and create bar and circle graphs. Students answer statistical questions regarding the data.
Intel
Play Ball!
Math and sports meet on the baseball diamond in the first STEM lesson in a series of six that asks pupils to collect and perform comparative analyses of data specific to baseball. Following the analysis, scholars create a presentation...
Curated OER
What Can Data Tell Us?
Students analyze data they have collected themselves and by their classmates. In groups, they create data distributions to identify the highest, lowest and middle values. As a class, they discuss the concept of sample size and how it can...
Radford University
Big Future - How SAT Scores Play a Role in College Acceptance
Understanding the importance of SAT scores is as easy as ABC. A set of three statistics lessons teaches scholars about normal distributions, the Empirical Rule, and z-scores. They apply their newfound knowledge to investigate data...
Curated OER
Who Freed the Slaves During the Civil War?
Pose the question to your historians: who really freed the slaves? They critically assess various arguments, using primary sources as evidence. In small groups, scholars jigsaw 5 primary source documents (linked), and fill out an...
101 Questions
Breaking a Record
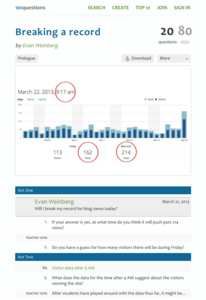
Can we break the record? Groups use provided data detailing the number of visitors to a blog to determine if the number of blog views breaks the previous record. They must take rates into consideration to make their estimates—a great...
Curated OER
Popular Music and Music Videos
This resource is part of a three-activity unit that introduces your class to the concept of popular culture and the role that it plays in their lives. Here, learners examine the importance of the music industry and music videos in pop...
Curated OER
Unexpected Answers
High schoolers explore the concept of fairness. In this fairness lesson, students play four probability games. High schoolers determine who has the best chance of winning each of the four games. Students discuss which games gave an...
Curated OER
CAN WE SWITCH GENDERS OF STORY CHARACTERS?
Analyze characters and stories to identify stereotyping. Learners will examine the concept of character gender to evaluate bias in classroom story books. They are asked to read a story or play and change the gender of the character to...
Curated OER
Games Children Play
Help your middle schoolers recognize the similarities and differences between the games they play and those played by pioneer children. Using the Internet, they research a game of their choice and discover how it has evolved over time....
Curated OER
Analyzing Messages in Various Media
Explore communication through media by analyzing different advertisements and artwork. Budding artists view videos, websites, plays, and other artistic endeavors while discussing the true meaning of the work with their classmates. They...
CK-12 Foundation
Two-Sided Stem-and-Lead Plots: Gamers
Which gender spends more time playing video games? Your classes use provided data to answer this question. They first build a two-sided stem-and-leaf plot and then use the display to look for patterns. Guiding questions help them...
Curated OER
Data and Probability- What's the Chance?
Young scholars investigate probability through a game. In this data lesson, students use dice and predictions to explore how probability works.
Curated OER
From Playing with Electronics to Data Analysis
Students collect and Analyze data. In this statistics lesson, students identify the line of best fit of the graph. They classify lines as having positive, negative and no correlation.
Student Achievement Partners
Jacob and Wilhelm Grimm - "The Fisherman and his Wife"
Help young readers learn to read and interpret complex text independently. Teach young children to ask interpretive questions and use the text itself to answer them. Use art, word play and drama to provide a deeper understanding of...
Curated OER
Wagons Ho! Hard Times! Hard Choices!
You have just hit the lesson plan jackpot! This isn't just a lesson, it's a ten-day unit covering westward expansion, pioneer life, and the Oregon Trail. Activities include baking, model building, role-play, newspaper writing, science...
TryEngineering
Data Representation: Millions of Colors
How many colors do you know? The lesson teaches scholars how digital devices use binary and hexadecimal representations to store colors. They learn how millions of colors are available on these devices.
CK-12 Foundation
Matrices to Represent Data: Houndstooth
Apply matrices to fashion. Here your classes use a matrix to create a popular clothing design. As they construct the pattern, they review the dimensions of a matrix by considering the rows and columns.
Other popular searches
- Anne Frank Play Analysis
- Drama Play Analysis
- Literature: Play Analysis
- Students Play Analysis
- Character and Play Analysis
- Play Analysis Ideas


