Curated OER
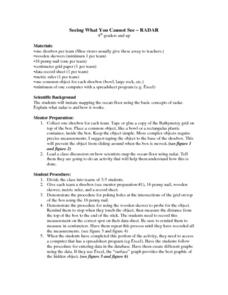
Seeing What You Cannot See--RADAR
Student imitate mapping the ocean floor using the basic concepts of radar. Then they explain what radar is and how it workds. All of their measurements are recorded on a data sheet. Then the data is entered into a spreadsheet program. A...
Teach Engineering
Catching the Perfect SAR Waves!
Zero in on an interesting resource involving radar technology. Groups construct a radar sensing unit and learn to calibrate the system. Using the radar system and the Pythagorean Theorem, they calculate distances between objects.
Teach Engineering
Weather Forecasting
According to the Farmers' Almanac, the weather will be nice today. Class members examine how weather forecasting plays a part in their lives with a resource that provides information on the history of forecasting, from using cloud...
Curated OER
Altimetry
Fifth graders accurately measure the distance to eight points on an uneven surface by conducting a simulation of sattelite altimetry. They create a two-dimensional model of the simulated ocean surface by graphing data from the Radar Run...
Teach Engineering
Wimpy Radar Antenna
The Diary of a Wimpy Antenna? In the last installment of a six-part series, your class constructs a model of a radio antenna and tests its torque. Pupils use the results to design a better model that resists bending and twisting forces.
Curated OER
Seeing Sound and Sonar
Young scholars grasp how underwater animals can "see" using sound waves. They practice making inferences, and build a conceptual understanding of sonar radar.
Space Awareness
Oceans on the Rise
Temperature rises and land disappears! Through a lab exploration, learners understand the effect of temperature increase on water similar to the effect of global warming on our oceans. As they heat the water in a flask, they measure the...
Curated OER
Probes, Exploration and Application
Students examine the benefits of the space program to our life on earth. In this space exploration lesson students participate in a lab, answer questions and study radar mapping.
Curated OER
EWOC2006-Make your own weather forecast - WEST
Students explore making their own weather forecast. They view and discuss a forecasting PowerPoint presentation. Students analyze radar and satellite imagery. They compile many ways to observe clouds.
Curated OER
Tracking the Weather Using Technology
Fourth graders explore the use of technology to monitor and forecast weather. They investigate the different types of weather monitoring and forecast tools. Students interpret radar images and discuss the traditional types of weather...
Curated OER
Slope-Intercept Form of a Line
Using the subscriber website Explorelearning.com, young mathematicians observe changes in the slope and y-intercept and their effect on the graph of lines. This activity helps students develop an intuitive sense of the connection between...
Space Awareness
Valleys Deep and Mountains High
Sometimes the best view is from the farthest distance. Satellite imaging makes it possible to create altitude maps from far above the earth. A three-part activity has your young scientists play the role of the satellite and then use...
Curated OER
Too Heavy For Me
Students explore the different arrangement of air molecules in high and low air pressure masses. They compare the temperature of high and low pressure masses and discover how a barometer works.
Curated OER
A Comparison Study of Water Vapor Data to Precipitation over North America
Students use NASA satellite data to compare water vapor over the United States. In this data analysis lesson students use an Excel spreadsheet to map their data.
Illustrative Mathematics
Speed Trap
In which direction is traffic moving faster, north or south? Use box and whisker plots to organize data and interpret the results. Detailed solutions are included. This activity would be good as a warm up or quick assessment at the...
Curated OER
Using the Synoptic Code for the Prediction of Weather
Young scholars interpret the synoptic code. They construct a thermoscreen with an anemometer. Students identify different types of clouds and understand and read barometric pressure. Young scholars predict weather pattern as they apply...
Curated OER
Seeing Sound & Sonar
Students make inferences based on different sounds that they hear. In this inferences lesson plan, students will hear sounds of different objects and describe the sounds based on what they hear. They will answer various questions about...
Curated OER
Chemical Sleuthing
Students engage in a lesson which includes flame tests and the construction of a simple diffraction spectrograph with which to measure sodium ion emissions. They use the Bragg equation to compute the wavelength of the line spectra produced.
Curated OER
Tornadoes
Students examine the characteristics of a tornado. They practice using new vocabulary and participate in a question and answer session. They use the internet to gather more specific information.
Curated OER
Sound for Sight
Students study echolocation and understand how dolphins use it to locate prey, escape predators, and navigate their environment. They view a video, "In the Wild-Dolphins with Robin Williams" and see first hand how dolphins communicate. ...
Curated OER
TE Lesson: Tsunami Attack!
Students examine how earthquakes, volcanoes, and landslides can trigger tsunami waves. They determine how engineers use sensors to detect the dangerous wave, and how they help design building that will survive the wave force and water.
Curated OER
Trends Forecasting
Students practice trends forecasting to predict the weather. In this forecasting lesson plan, students learn how meteorologists predict the weather by looking at weather trends. They then predict their own forecast, analyze the results,...
Curated OER
Mystery Spill
Students investigate the cause of birds dying in Monterey Bay. In this scientific research instructional activity, students use various resources, scientific investigations, and vector analysis to solve an environmental mystery.
Curated OER
Scatter Plots
Seventh graders investigate how to make and set up a scatter plot. In this statistics lesson, 7th graders collect data and plot it. They analyze their data and discuss their results.
Other popular searches
- Doppler Radar
- Radar Mapping
- Dopplar Radar
- Ground Penetration Radar
- Sonar and Radar
- Weather Satellites Radar
- Weather Radar
- Radar Rome
- Radar Shoe Box
- Radar Shoe Box Clay
- Radar Language
- Radar Maps


