World Wildlife Fund
Graphs and Charts
A two-part worksheet incorporating bar graphs and pie charts, young mathematicians can practice their graphing skills. Pupils answer questions using graphs and charts but are also challenged to create their own using a given set of data.
Mathed Up!
Tallys and Charts
After watching a brief instructional video, young mathematicians are put to the test. By completing and reading frequency tables, tally charts, and bar graphs, individuals show their understanding of how to interpret data.
Math Worksheets Land
My Favorite Animal At The Zoo Pie Graph
What is your favorite animal at the zoo? Young mathematicians answer eight multiple choice questions, based on a survey of 50 people presented in a pie graph. Additionally, the graph does not display any numbers, but rather...
IXL Learning
Small Times Table Reference Charts
Support young mathematicians on their journey to fluent multiplication with these handy reference tables. Small enough to fit in their pockets, these charts allow children to practice their multiplication facts anywhere they go.
Math Worksheets Land
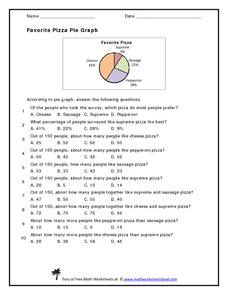
Favorite Pizza Pie Graph
You've heard of a pie graph, but what about a pizza pie graph? Challenge young mathematicians to answer ten questions based on a random survey of people's favorite pizzas. A pie graph displays the percentages of each type of pizza. Some...
Math Worksheets Land
Reading and Making Pie Graphs Worksheets
The opportunities are endless with a collection of five worksheets that enable young mathematicians to read pie graphs. Individuals use graphs to answer eight multiple choice questions on each sheet. The set of five allows for...
PBIS World
Tier 1 Intervention General Tracking Form
Looking for a way to compile data based on behavior interventions? This spreadsheet can help you out! You type in up to five behaviors and five interventions and tally whenever a behavior or intervention is used. The spreadsheet...
Math Worksheets Land
Pie or Circle Graphs - Guided Lesson
A guided lesson worksheet reinforces pie graph skills using a given set of data. Each problem requires young mathematicians to create a circle graph using five colors, and to provide a key that goes along with the graph.
Curated OER
Using Graphs and Charts
Students complete T charts and manipulate numbers using graphs and charts. For this math graphs and charts lesson, students review the concepts of pattern and function. Students then complete practice pages where they manipulate numbers...
Curated OER
Thanksgiving Feast (Read the Charts)
Young scholars practice reading charts about foods country of origin. They interpret information and answer questions related to charts. They discover how food production adds to the economy.
Curated OER
Charting and Graphing Sales
Students analyze graphs, charts and tables. In this data analysis instructional activity, students practice creating and analyzing charts, graphs and tables corresponding to sales and surveys. This instructional activity uses data...
Curated OER
Pie Graph
Fifth graders examine fractional parts of pie graphs. Given a bag of M&Ms, 5th graders interpret the data. They use a paper plate and colors to create a graph of the types of M&Ms represented.
Curated OER
Flow Charts
Students explore the use of flow charts and cyclical diagrams. They discuss how to read the charts. Students produce a simple flow chart or diagram to explain a process. They investigate various methods used to present text.
Math Worksheets Land
Pie or Circle Graphs Problems - Independent Practice Worksheet
Third graders take a set of data and turn it into a pie graph with an independent worksheet. Containing 10 sets of data, the resource reinforced data analysis skills that pupils can use throughout a graphing unit.
Curated OER
Bar Graphs and Pie Charts
Students graph data they collected and analyze it using a bar graph. For this algebra lesson, students analyze their data using pie charts and bar graphs while explaining the meaning to each other. They compare and contrast bar...
Raytheon
Data Analysis and Interpretation
For this data analysis and interpretation worksheet, learners use charts, graphs, statistics to solve 42 pages of problems with answer key included.
San Jose Unified School District
Multiplication Chart
Looking to support your young mathematicians with mastering their multiplication facts? Then this set of multiplication charts is a great place to start, allowing children to visualize the the relationships between factors and multiples.
Scholastic
Adding and Subtracting Ten
Developing fluency with basic addition and subtraction is fundamental to the success of all young mathematicians. This four-day lesson series begins with learners using ten-frames and hundreds charts to recognize patterns when adding and...
Math Moves U
Collecting and Working with Data
Add to your collection of math resources with this extensive series of data analysis worksheets. Whether your teaching how to use frequency tables and tally charts to collect and organize data, or introducing young...
Yummy Math
US Holiday Candy Sales
Candy is a big business! Calculate the amount of money consumers spent on major holidays—Easter, Halloween, Christmas, Hanukkah, and Valentine's Day—based on the total amount of candy sales from 2011 and the percentage of each holiday's...
Fluence Learning
Writing About Informational Text: Everybody Can Bike
A three-part assessment challenges scholars to read informational texts in order to complete three tasks. Following a brief reading, class members take part in grand conversations, complete charts, and work in small groups to research...
Fluence Learning
Writing About Literary Text: Wise or Foolish?
A three-part assessment promotes reading comprehension skills. Class members read literary texts and take notes to discuss their findings, answer comprehension questions, write summaries, and complete charts.
Curated OER
Vocabulary Charts
Students create their own vocabulary charts. They divide into groups and view an example of a vocabulary chart imbedded in this plan. Then, they create their own chart which is based on a particular subject area.
Santa Barbara City College
How to Make a Multiplication Table
Teach children how to make a multiplication table, and they'll be multiplying for life. Following this series of steps, young mathematicians learn to use patterns and the relationships between numbers to create...
Other popular searches
- Charts and Graphs
- Multiplication Charts
- Maps and Charts
- Tally Charts
- Pie Charts and Graphs
- Pie Chart
- Multiplication Charts to 100
- Reading Charts and Graphs
- Behavior Charts and Graphs
- Charts and Graphs Candy
- Interpret Charts and Graphs
- Charts and Graphs Christmas


