Curated OER
Survey and Tally
Second graders view a model of a survey and tally. In this survey and tally instructional activity, 2nd graders decide on questions for a survey. Students conduct the survey and tally their results. Students create a...
National Security Agency
Starting a Restaurant
Through an engaging unit, chefs-in-training will sort and classify data using tally charts. Learners will also create bar graphs to display restaurant data and interpret data from bar graphs using a variety of categories....
Curated OER
Irregular Word Fluency, Word Hunt Tally
Play games with your young word learners. They participate in games to develop word skills, working with a partner on a word hunt. As they work, they keep a tally of how many times they find their word in three minutes. They use...
Math Moves U
Collecting and Working with Data
Add to your collection of math resources with this extensive series of data analysis worksheets. Whether your teaching how to use frequency tables and tally charts to collect and organize data, or introducing young...
Curriculum Corner
St. Patrick's Day Themed Math and Literacy Practice
Look no further for St. Patrick's Day-themed math and literacy practice worksheets. Math skills allow for practicing counting to 100 by 5s, 10s, and 1s, as well as 10 more or 10 less, writing numbers in word and standard form,...
Beacon Learning Center
Spotted Stones Linked Just Right
Discover how to play the game of dominoes using mental math skills to solve equations that earn points. Pupils become fast critical thinkers in determining which unknown addend tally up points in their favor.
Curated OER
Investigation-What are My Chances?
Second graders explore probability. In this math lesson plan, 2nd graders discuss the possibility of choosing a certain colored tile from a bag. Students perform experiments and describe the outcomes as certain, possible, unlikely and...
Curated OER
What's your favorite physical fitness activity?
Fourth graders engage in a class discussion where they create a list of their favorite physical fitness activities. They tally the numbers on the board and use Microsoft Excel to create a spreadsheet and graph of the activities.
Buffalo-Hanover Montrose Schools
Histogram Worksheet
Young mathematicians analyze a given set of numbers to complete a frequency table, and then make a histogram using the data. The worksheet includes three sets of data on the worksheet.
Curated OER
Color Tile Graphing
Students explore data. They gather data and generate questions about the data in pictographs, tallies, tables, and bar graphs. Students use color tiles pulled by random to create their own bar graph. They discuss the bar graphs they...
Curated OER
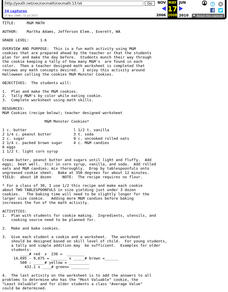
M&M Cookie Math
Students munch their way through a cookie keeping a tally of how many M&M's are found of each color.
Curated OER
Virtual Field Trip
Learners calculate gasoline cost per mile on a virtual field trip. They calculate the gasoline costs and travel time for each of the 2 routes, and record on a data sheet. They use Excel to create data tables for mileage, gasoline...
Curated OER
1-2-3 Go!
Students practice becoming fluent readers with timed repeated readings. They read passages for one minute and tally the number of words read. They repeat this process several times and count the number of words each time. They complete...
Curated OER
Trading Faces
The game of "Trading Faces" is the focus of this clever math lesson. Your mathematicians use addition to determine the values of different coin combinations by playing the game. Everything you need to implement the game, and the lesson,...
Curated OER
Mathematics of Fair Games
Students examine mathematicians' notion of fairness in games of chance. They work in pairs to perform three different experiments using macaroni and paper bags. They record their results on charts and compare their data.
Curated OER
Simply Speaking
Emerging orators distinguish between effective and ineffective public speaking strategies. They read a text that fits in with a Native Americans unit and speak about the text with both ineffective and effective volume, tone, phrasing,...
Raytheon
Data Analysis and Interpretation
For this data analysis and interpretation worksheet, learners use charts, graphs, statistics to solve 42 pages of problems with answer key included.
Curated OER
Graphing Favorite Fruit
Third graders take poll and sort data, enter the data to create a spreadsheet and create bar and pie graphs.
Curated OER
Chances Are
Upper graders examine the concept of probability. They collect data and create a bar graph. They must interpret the data as well. Everyone engages in hands-on games and activities which lead them to predict possible outcomes for a...
Primary National Strategy
Ordering and Counting
Are you in need of a 5-day unit intended to teach little learners how to count to 20? This is a well-structured complete set of lessons which employ a variety of methods to instruct learners about various ways to count from 1 to 20. They...
Curated OER
Grocery Races
Fifth graders apply their knowledge of math in a grocery shopping trip. In this math lesson, 5th graders use addition, subtraction, multiplication and division to help them with their shopping. The teacher sets up a mock supermarket in...
Curated OER
Probability with Number Cubes
Second graders make sampling predictions, predict outcomes and explore probability through experimentation.
Curated OER
Graphs: All About Our Class
Students respond to survey questions, discuss results, brainstorm ways to represent survey information, and create table of class results. They find mean, range, and percentages, and create graph to display results.
World Wildlife Fund
Take 6
Investigate the various properties of the number six with this elementary math lesson. From simple addition, subtraction, multiplication, and division problems to the creation of hexagonal tessellations, this lesson covers all aspects of...


