West Contra Costa Unified School District
Talking About Distance, Rate and Time
Connect the tortoise and the hare fable to mathematics. Learners first identify key terms related to distance, rate, and time. They then solve distance/rate/time problems using different representations.
West Contra Costa Unified School District
Using Bar Models to Solve Rate Problems
Pupils visualize distance-rate-time problems by using bar models. The instructional activity presents examples of four different types of rate problems and shows how they can be solved using bar models and equations. Each example is...
Worksheet Web
Learning About Rate
After reading a one-page passage on how to understand and solve distance/rate problems, young mathematicians answer six word problems that have them correctly set up the formula in order to solve for the distnace, rate, or time in the...
West Contra Costa Unified School District
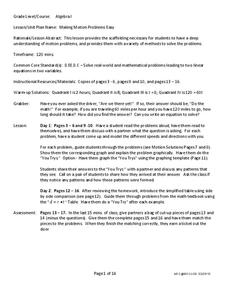
Motion Problems
Let's hope class participants don't get motion sickness. In the lesson, class members first solve motion problems using tables and graphs. They then use algebraic techniques to solve motion problems.
CK-12 Foundation
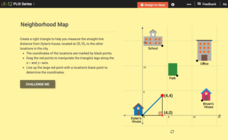
Pythagorean Theorem to Determine Distance: Neighborhood Map
Find the distance between various locations in a neighborhood. Scholars use the interactive to find distances between locations on a map. The map is overlaid onto a grid to provide coordinates for each location, and pupils apply...
Willow Tree
Weighted Averages
Mixtures, weighted percentages, and varying speeds make problem solving difficult. The resource give learners a strategy for tackling these types of problems effectively.
West Contra Costa Unified School District
Solving and Using Literal Equations
You literally need to use the resource. Young mathematicians solve geometric problems by using literal equations. They go on to solve distance/rate/time problems by using literal equations — a great progression that helps introduce the...
Mathed Up!
Distance Time Graphs
If only there was a graph to show the distance traveled over a period of time. Given distance-time graphs, pupils read them to determine the answers to questions. Using the distance and time on a straight line, scholars calculate the...
Curated OER
Use Google Maps to Teach Math
Capture the engagement of young mathematicians with this upper-elementary math lesson on measuring time and distance. Using Google Maps, students first measure and compare the distance and time it takes to travel between different...
CK-12 Foundation
Formulas for Problem Solving: Finding Distance, Rate, and Time
Go the distance in learning about distance, rate, and time. Young mathematicians use an interactive to investigate the relationship between distance, rate, and time. A set of challenge questions assesses understanding of these...
EngageNY
Constant Rates Revisited
Find the faster rate. The resource tasks the class to compare proportional relationships represented in different ways. Pupils find the slope of the proportional relationships to determine the constant rates. They then analyze the rates...
BW Walch
Creating Linear Equations in One Variable
The example of two travelers meeting somewhere along the road has been a stereotypical joke about algebra as long as algebra has existed. Here in this detailed presentation, this old trope gets a careful and approachable treatment....
Cabrillo College
Elementary Algebra
Hello Algebra! If you're in need of a resource with a books worth of examples and practice problems, this is it. Some topics include linear equations, polynomials and exponents, rational expressions, quadratic equations, and a great...
EngageNY
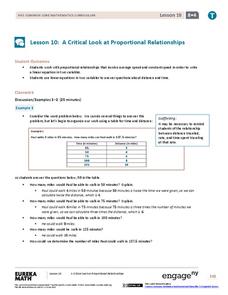
A Critical Look at Proportional Relationships
Use proportions to determine the travel distance in a given amount of time. The 10th installment in a series of 33 uses tables and descriptions to determine a person's constant speed. Using the constant speed, pupils write a linear...
Mathed Up!
Compound Measures
Compounding is dividing units. Pupils practice using compound measures such as units for speed and density to solve problems that range from straightforward speed problems to those requiring conversions. The last few items challenge...
Corbett Maths
Area under a Graph
What? The calculation of area is a linear distance? A short video shows how to use the areas of simple polygons to estimate the area under a graph. Pupils divide the area under a curve into figures to easier calculate the area. Given...
Mr. E. Science
Motion
An informative presentation covers motion, metric system, conversions, graphing of coordinates and lines, speed, velocity, and acceleration problems, as well as mean calculations. This is the first lesson in a 26-part series.
EngageNY
Introduction to Simultaneous Equations
Create an understanding of solving problems that require more than one equation. The lesson introduces the concept of systems of linear equations by using a familiar situation of constant rate problems. Pupils compare the graphs of...
CCSS Math Activities
Smarter Balanced Sample Items: 6th Grade Math – Claim 2
They claim there are problems on the assessment. The presentation provides 13 questions that demonstrate the problem-solving claim for Smarter Balanced assessments. Teachers use the resource to provide examples of problem-solving...
Del Mar College
Formulas for Elementary and Intermediate Algebra
Give your scholars the support they need to work with formulas. A reference page offers definitions and picture examples of perimeter, area, surface area, volume, the Pythagorean theorem, a variety of shapes, and more.
EngageNY
Comparing Linear Functions and Graphs
How can you compare linear functions? The seventh installment of a 12-part module teaches learners how to compare linear functions whose representations are given in different ways. They use real-world functions and interpret features in...
Willow Tree
Formulas
Help learners understand the benefits of rearranging a formula. Scholars practice rearranging formulas for specific variables. They also analyze formulas to understand one variable's effect on the other.
Curated OER
Circular Motion
A helpful physics presentation will have you talking in circles! The material covers circular motion, and includes diagrams, formulas, and example problems. When used in addition with directed instruction and a teacher-created form of...
EngageNY
Graphs of Functions and Equations
Explore the graphs of functions and equations with a resource that teaches scholars how to graph functions as a set of input-output points. They learn how the graph of a function is the graph of its associated equation.


