EngageNY
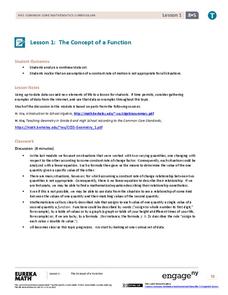
The Concept of a Function
Explore functions with non-constant rates of change. The first installment of a 12-part module teaches young mathematicians about the concept of a function. They investigate instances where functions do not have a constant rate of change.
02 x 02 Worksheets
Inverse Variation
Discover an inverse variation pattern. A simple lesson plan design allows learners to explore a nonlinear pattern. Scholars analyze a distance, speed, and time relationship through tables and graphs. Eventually, they write an equation to...
EngageNY
Graphs of Quadratic Functions
How high is too high for a belly flop? Learners analyze data to model the world record belly flop using a quadratic equation. They create a graph and analyze the key features and apply them to the context of the video.
EngageNY
Patterns in Scatter Plots
Class members investigate relationships between two variables in the seventh installment of a 16-part module that teaches scholars how to find and describe patterns in scatter plots. Young mathematicians consider linear/nonlinear...
Charleston School District
Increasing, Decreasing, Max, and Min
Roller coaster cars traveling along a graph create quite a story! The lesson analyzes both linear and non-linear graphs. Learners determine the intervals that a graph is increasing and/or decreasing and to locate maximum and/or minimum...
Inside Mathematics
House Prices
Mortgages, payments, and wages correlate with each other. The short assessment presents scatter plots for young mathematicians to interpret. Class members interpret the scatter plots of price versus payment and wage versus payment for...
National Security Agency
Multiple Representations of Limits
After an introductory activity to demonstrate the theory of a limit, additional activities approach a limit from graphical, numerical, and algebraic methods. The activity looks at the multiple ways of understanding and evaluating a limit.


