Core Knowledge Foundation
Weather or Not, Seasons Change
Embark on a year long investigation of the seasons with this 10-lesson earth science unit. After being introduced to different types of weather and the tools used to measure it, young scientists perform fun hands-on activities that teach...
Union County Vocational Technical Schools
Engineering Drawing
Knowing the basics of drafting allows individuals to create drawings that show all the views and measurements necessary to allow others to visualize the original object. Pupils gain experience by drawing three orthographic views of an...
Space Awareness
Britannia Rule the Waves
Could you determine longitude based on measuring time? Early explorers used a longitude clock to do just that. Scholars learn about early exploration and the importance of the invention of the clock. Then pupils build their own longitude...
Chicago Botanic Garden
Weather or Not
What is the difference between weather and climate? This is the focus question of a lesson that takes a deeper look at how weather data helps determine climate in a region. Using weather and climate cards, students decide if a statement...
NASA
Connecting Models and Critical Questions
Scholars use data to analyze and determine which sets of information need to be counted. They create a model to explain differences among chemical elements using graphs to prove concept mastery.
Project Maths
Planes and Points
Build a solid foundation on which to develop future concepts. Through a guided exploration, learners compare and contrast the characteristics of points, lines, planes, rays, and segments. They measure lengths and practice notation for...
Lied Center of Kansas
The Ugly Duckling and The Tortoise and the Hare
Both The Ugly Duckling and The Tortoise and the Hare are great additions to an elementary language arts lesson. Young readers focus on the literary elements of each story, including characters and plot development, and apply counting and...
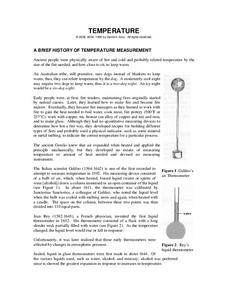
Chymist
Temperature
Three Dog Night isn't just the name of a band; it is also the way an Australian tribe, who used dogs to stay warm, would describe the temperature on a cool evening. After reading about many different ways of measuring temperature, the...
Concord Consortium
Center of Population
Let the resource take center stage in a lesson on population density. Scholars use provided historical data on the center of the US population to see how it shifted over time. They plot the data on a spreadsheet to look the speed of its...
Inside Mathematics
Suzi's Company
The mean might not always be the best representation of the average. The assessment task has individuals determine the measures of center for the salaries of a company. They determine which of the three would be the best representation...
Mathematics Assessment Project
Suzi's Company
Don't use an average resource ... use this one. As a middle school assessment task, learners first determine mean, median, and mode of salaries given in a frequency table. They then investigate how a change in one value changes the...
Chicago Children's Museum
Simple Machines: Force and Motion
Get things moving with this elementary science unit on simple machines. Through a series of nine lessons including teacher demonstrations, hands-on activities, and science experiments, young scientists learn about forces, motion, and...
Mathed Up!
Pie Charts
Representing data is as easy as pie. Class members construct pie charts given a frequency table. Individuals then determine the size of the angles needed for each sector and interpret the size of sectors within the context of frequency....
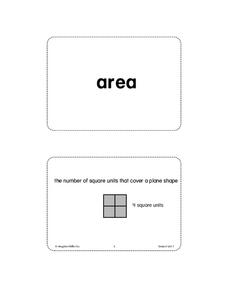
Houghton Mifflin Harcourt
Unit 7 Math Vocabulary Cards (Grade 2)
Reinforce math vocabulary instruction with a set of flash cards. Fifty-six cards offer either a bold-face word or a picture representation equipped with descriptive labels. Terms include centimeters, gallons, square units, and more!
Polar Trec
Beacon Valley Weather
In Beacon Valley, katabatic winds regularly knock fit adults to the ground. The lesson compares the actual temperatures to the wind chill after factoring in katabatic winds in Beacon Valley. Scholars learn to calculate wind chill and...
National Geographic
National Geographic: Measuring Weather With Tools
Work with students to identify and understand the tools used to measure weather and how they're used.
Texas Instruments
Texas Instruments: What's the Scale?
The objective of this lesson is to have students determine the scale of a model when compared to the actual object. They will measure parts of the actual object and then compare the corresponding part of the model to determine the scale...
Texas Instruments
Texas Instruments: Collecting Data in Geometry
This activity is designed for students to make conjectures about triangles. Students will create three lists to represent the measures of the angles of the triangle. The entire class list will then be sent to each student for analysis,...
Texas Instruments
Texas Instruments: Friction
Students study how the nature of two materials in contact, and the smoothness of their surfaces affect the magnitude of the sliding force of friction. They use a force sensor to measure frictional force for different surfaces.
Texas Instruments
Texas Instruments: Describing One Variable Data
Students sort data and display it graphically using various plots. They also get familiarized with statistical concepts like measures of spread and central tendency.
Texas Instruments
Texas Instruments: Looking for Mr. Right Triangle
Navigator Activity: This is a review of the right triangle in the coordinate plane. Given two lines (2 really nice ones) the students write the equation of the 3rd line to create a right triangle. They find the vertices of the triangle...
Texas Instruments
Texas Instruments: Keep It Bottled Up: Linear Rates of Pressure Increase
In this activity, students' examine how temperature affects the rate of gas production during a chemical reaction. They measure this rate by recording the pressure variation using a pressure sensor and model the pressure data using a...
Texas Instruments
Texas Instruments: Simple Programs to Apply Formulas
Students learn how to write simple programs to evaluate formulas in several variables for lists of data. They apply these skills to the computation of areas, volumes and surface areas of familiar geometric solids.
CK-12 Foundation
Ck 12: Earth Science: Collecting Weather Data
[Free Registration/Login may be required to access all resource tools.] Describes the various instruments that scientists use to measure weather conditions, including advanced tools like satellites and radar.


