Curated OER
Pictures of Data
In this data worksheet, students look at maps and charts and answer multiple choice questions about them. Students complete 10 questions.
Curated OER
Let's Graph It
In this let's graph it activity, student interactively answer 10 multiple choice questions about graphing data and types of graphs, then click to check their answers.
Curated OER
Using Data To Make Graphs
In this using data to make graphs worksheet, students interactively answer 10 multiple choice questions then click to check their answers.
Curated OER
Gender and Income
Students investigate Income and gender preference. In this statistic lesson, students collect data of Income to see if one gender makes more than the other. Students examine the data and draw conclusions.
Curated OER
Obstacles to Success: Misleading Data
Eleventh graders explore how data reported by country agencies can mislead the public intentionally or unintentionally. In this Cross Curricular activity, 11th graders analyze charts and graphs in order to draw conclusions. Students...
Curated OER
Completing frequency diagrams from displayed data
In this frequency worksheet, students use data in graphs and charts to complete a frequency diagram. Students fill in 26 spaces in the diagram.
Curated OER
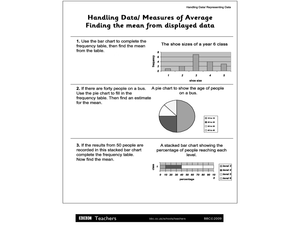
Handling Data/Measures of Average - Finding the Mean from Displayed Data
For this mean and average worksheet, learners use the bars and charts to help them find the means using the given data. Students solve 3 problems.
Curated OER
Exploring the USA and the World with Cartograms
Learners investigate cartograms in order to explore the different countries on Earth. In this world geography activity, students use the Internet to analyze data on different cartograms. Learners compare data, such as population density,...
Curated OER
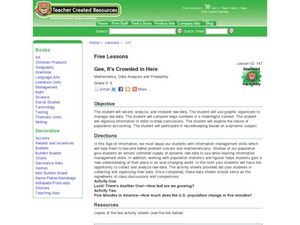
Gee, It's Crowded in Here
Students interpret raw data about population statistics. In this raw data lesson plan, students plug the data into graphic organizers and draw conclusions based on their findings.
Curated OER
Organizing Data
Third graders investigate ways to organize data. In this tally marking lesson plan, 3rd graders practice drawing tally marks to represent an item of data. Students also make connections with skip counting by fives.
Curated OER
Data Analysis: Investing is an "Interesting" Experience
Students compute interest earned. For this data analysis lesson, students examine investments and interest rates. They compute the total interest earned and find the simple interest.
Curated OER
Data Handling: Sorting Shapes
In this recording data and shape sorting worksheet, students color a chart to show how many green cubes and yellow cylinders are shown. They color the correct number of each shape.
Curated OER
IT IS ABOUT SUPPLY AND DEMAND.
Students learn that the price of an item is defined by its supply and demand. In this activity students graph the relationship between demand and supply of various products, students also consider hidden costs.
Curated OER
Cent Sense
Students identify money values. In this money lesson, students sort and group coins by value and investigate the cost of supplies needed for a snack. Students prepare snacks for a snack sale.
Curated OER
Data and Probability- What's the Chance?
Students investigate probability through a game. In this data lesson plan, students use dice and predictions to explore how probability works.
Curated OER
Learning to Make Data Tables
Students construct data tables using the results of previous experiments. In this graphing lesson plan, students plot data and interpret the results. Students discuss how they organized their data.
Curated OER
Learning to Make Bar Graphs
Students construct bar graphs using the results from various experiments. In this graphing lesson, students review data from a previous experiment and demonstrate how to construct a bar graph. Students use a checklist to ensure...
Curated OER
Point Graphs
Students experiment with point graphs. In this math lesson, students are divided into groups and perform an experiment to see how high a ball bounces, recording their results on a point graph. Students then answer provided questions.
Curated OER
Line Plots
In this line plot worksheet, students create a line plot of given data. They identify the range, clusters, gaps, and outliers. This one-page worksheet contains 8 multi-step problems.
Curated OER
Measuring
In this measuring worksheet, students answer 10 questions about the scientific method, scientific law, hypotheses and data. They also answer 2 questions about biomes and wetlands.
Curated OER
Graphing Family Reading Habits
Second graders collect data from their families about their reading habits and graph them. In this graphing family reading habits lesson, 2nd graders interview family members about their reading habits. They then use a graphing computer...
Curated OER
Evaluating Data
In this data worksheet, students learn how to organize the data collected during an experiment and practice finding patterns. Students graph a table of experimental data and complete 1 short answer question.
Curated OER
Getting There
Students practice reading a pictograph. In this data analysis lesson, students collect data and create their own pictograph. A students worksheet is included.
Curated OER
Parts of Lab Report Review Sheet
In this lab report worksheet, students answer ten questions by filling in a blank with the appropriate letter that corresponds to the part of the lab. Students determine where data goes, where observations go, where answers to discussion...


